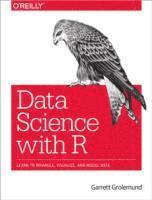
- Format
- Häftad (Paperback / softback)
- Språk
- Engelska
- Antal sidor
- 522
- Utgivningsdatum
- 2017-01-31
- Upplaga
- 1
- Förlag
- O'Reilly Media
- Illustrationer
- colour illustrations
- Dimensioner
- 224 x 150 x 30 mm
- Vikt
- Antal komponenter
- 1
- Komponenter
- ,
- ISBN
- 9781491910399
- 704 g
R for Data Science
Import, Tidy, Transform, Visualize, and Model Data
Kundrecensioner
Fler böcker av författarna
-
Data Analysis with R
Garrett Grolemund
-
R Markdown
Yihui Xie, J J Allaire, Garrett Grolemund
-
Hands-On Programming with R
Garrett Grolemund
-
R für Data Science
Hadley Wickham, Mine Çetinkaya-Rundel, Garrett Grolemund
Övrig information
Hadley Wickham is an Assistant Professor and the Dobelman Family Junior Chair in Statistics at Rice University. He is an active member of the R community, has written and contributed to over 30 R packages, and won the John Chambers Award for Statistical Computing for his work developing tools for data reshaping and visualization. His research focuses on how to make data analysis better, faster and easier, with a particular emphasis on the use of visualization to better understand data and models.Garrett Grolemund is a statistician, teacher and R developer who currently works for RStudio. He sees data analysis as a largely untapped fountain of value for both industry and science. Garrett received his Ph.D at Rice University in Hadley Wickham's lab, where his research traced the origins of data analysis as a cognitive process and identified how attentional and epistemological concerns guide every data analysis.
