Häftad, Engelska, 2011
447 kr
Skickas inom 3-6 vardagar
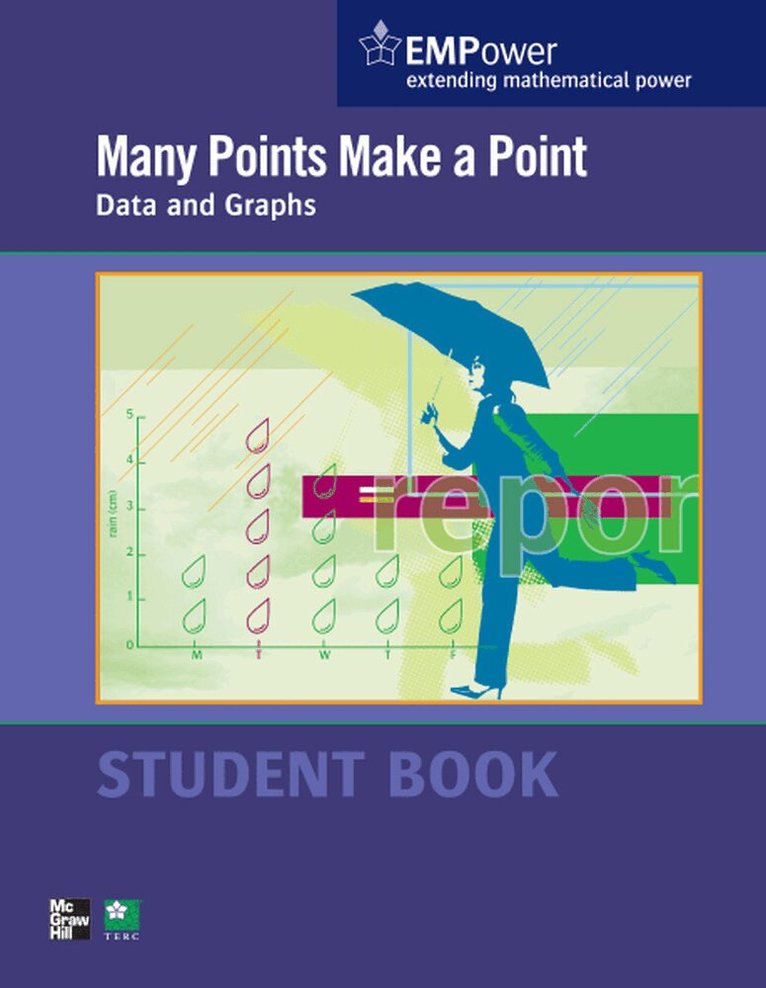
Students collect, organize, and represent data using frequency, bar, and circle graphs. They use line graphs to describe change over time. They use benchmark fractions and the three measures of central tendency—mode, median, and mean— to describe sets of data.