
Brian Everitt – författare
1 033 kr
Skickas inom 10-15 vardagar
364 kr
Läs direkt efter köp
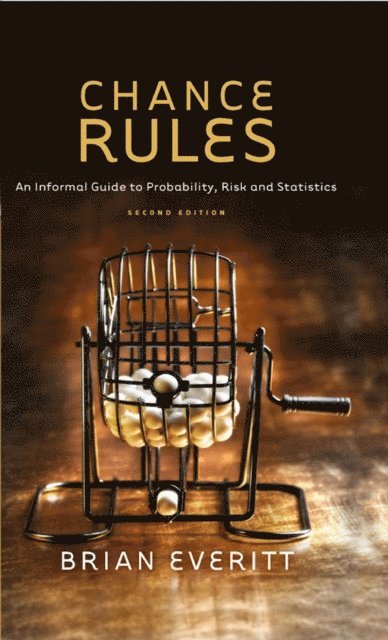
Chance continues to govern our lives in the 21st Century. From the genes we inherit and the environment into which we are born, to the lottery ticket we buy at the local store, much of life is a gamble. In business, education, travel, health, and marriage, we take chances in the hope of obtaining something better. Chance colors our lives with uncertainty, and so it is important to examine it and try to understand about how it operates in a number of different circumstances. Such understanding becomes simpler if we take some time to learn a little about probability, since probability is the natural language of uncertainty.
This second edition of Chance Rules again recounts the story of chance through history and the various ways it impacts on our lives. Here you can read about the earliest gamblers who thought that the fall of the dice was controlled by the gods, as well as the modern geneticist and quantum theory researcher trying to integrate aspects of probability into their chosen speciality. Example included in the first addition such as the infamous Monty Hall problem, tossing coins, coincidences, horse racing, birthdays and babies remain, often with an expanded discussion, in this edition. Additional material in the second edition includes, a probabilistic explanation of why things were better when you were younger, consideration of whether you can use probability to prove the existence of God, how long you may have to wait to win the lottery, some court room dramas, predicting the future, and how evolution scores over creationism. Chance Rules lets you learn about probability without complex mathematics.

254 kr
Skickas inom 10-15 vardagar
1 670 kr
Skickas inom 10-15 vardagar

942 kr
Läs direkt efter köp
1 227 kr
Läs direkt efter köp

2 959 kr
Skickas inom 10-15 vardagar

794 kr
Skickas inom 10-15 vardagar

942 kr
Läs direkt efter köp
The book is intended as a quick source of reference and as an aide-memoir for students taking A-level, undergraduate or postgraduate statistics courses. It includes numerous examples, helping instructors on such courses by providing their students with small data sets with which to work.

1 622 kr
Skickas inom 10-15 vardagar
814 kr
Skickas inom 10-15 vardagar
1 044 kr
Läs direkt efter köp
The majority of data sets collected by researchers in all disciplines are multivariate, meaning that several measurements, observations, or recordings are taken on each of the units in the data set. These units might be human subjects, archaeological artifacts, countries, or a vast variety of other things. In a few cases, it may be sensible to isolate each variable and study it separately, but in most instances all the variables need to be examined simultaneously in order to fully grasp the structure and key features of the data. For this purpose, one or another method of multivariate analysis might be helpful, and it is with such methods that this book is largely concerned. Multivariate analysis includes methods both for describing and exploring such data and for making formal inferences about them. The aim of all the techniques is, in general sense, to display or extract the signal in the data in the presence of noise and to find out what the data show us in the midst of their apparent chaos.
An Introduction to Applied Multivariate Analysis with R explores the correct application of these methods so as to extract as much information as possible from the data at hand, particularly as some type of graphical representation, via the R software. Throughout the book, the authors give many examples of R code used to apply the multivariate techniques to multivariate data.

1 223 kr
Skickas inom 10-15 vardagar

1 264 kr
Läs direkt efter köp

2 049 kr
Läs direkt efter köp