
Lindy Ryan – författare
482 kr
Skickas inom 10-15 vardagar
Data is powerful. It separates leaders from laggards and it drives business disruption, transformation, and reinvention. Today's most progressive companies are using the power of data to propel their industries into new areas of innovation, specialization, and optimization. The horsepower of new tools and technologies have provided more opportunities than ever to harness, integrate, and interact with massive amounts of disparate data for business insights and value - something that will only continue in the era of the Internet of Things. And, as a new breed of tech-savvy and digitally native knowledge workers rise to the ranks of data scientist and visual analyst, the needs and demands of the people working with data are changing, too.
The world of data is changing fast. And, it's becoming more visual.
Visual insights are becoming increasingly dominant in information management, and with the reinvigorated role of data visualization, this imperative is a driving force to creating a visual culture of data discovery. The traditional standards of data visualizations are making way for richer, more robust and more advanced visualizations and new ways of seeing and interacting with data. However, while data visualization is a critical tool to exploring and understanding bigger and more diverse and dynamic data, by understanding and embracing our human hardwiring for visual communication and storytelling and properly incorporating key design principles and evolving best practices, we take the next step forward to transform data visualizations from tools into unique visual information assets.
Discusses several years of in-depth industry research and presents vendor tools, approaches, and methodologies in discovery, visualization, and visual analytics Provides practicable and use case-based experience from advisory work with Fortune 100 and 500 companies across multiple verticals Presents the next-generation of visual discovery, data storytelling, and the Five Steps to Data Storytelling with Visualization Explains the Convergence of Visual Analytics and Visual discovery, including how to use tools such as R in statistical and analytic modeling Covers emerging technologies such as streaming visualization in the IOT (Internet of Things) and streaming animation
569 kr
Läs direkt efter köp
478 kr
Skickas
This is the first end-to-end, full-color guide to telling powerful, actionable data stories using Tableau, the world’s #1 visualization software. Renowned expert Lindy Ryan shows you how to communicate the full business implications of your data analyses by combining Tableau’s remarkable capabilities with a deep understanding of storytelling and design.
Each chapter illuminates key aspects of design practice and data visualization, and guides you step-by-step through applying them in Tableau. Ryan demonstrates how “data stories” resemble and differ from traditional storytelling, and helps you use Tableau to analyze, visualize, and communicate insights that are meaningful to any stakeholder, in any medium.
Information Visualization in Tableau presents exercises that give you hands-on practice with the most up-to-date capabilities available through Tableau 10 and the full Tableau software ecosystem. Ryan’s classroom-tested exercises won’t just help you master the software: they’ll show you to craft data stories that inspire action.
Coverage includes:
The visual data storytelling paradigm: moving beyond static charts to powerful visualizations that combine narrative with interactive graphics How to think like a data scientist, a storyteller, and a designer -- all in the same project Data storytelling case studies: the good, the bad, and the ugly Shaping data stories: blending data science, genre, and visual design Seven best practices for visual data storytelling -- and common pitfalls to avoid Tricks and hacks you can use with any toolset, not just Tableau
343 kr
Skickas inom 7-10 vardagar
Master the Fundamentals of Modern Visual Analytics--and Craft Compelling Visual Narratives in Tableau!
Do you need to persuade or inform people? Do you have data? Then you need to master visual analytics and visual storytelling. Today, the #1 tool for telling visual stories with data is Tableau, and demand for Tableau skills is soaring. In Visual Analytics Fundamentals, renowned visual storyteller and analytics professor Lindy Ryan introduces all the fundamental visual analytics knowledge, cognitive and perceptual concepts, and hands-on Tableau techniques you'll need.
Ryan puts core analytics and visual concepts upfront, so you'll always know exactly what you're trying to accomplish and can apply this knowledge with any tool. Building on this foundation, she presents classroom-proven guided exercises for translating ideas into reality with Tableau 2022. You'll learn how to organize data and structure analysis with stories in mind, embrace exploration and visual discovery, and articulate your findings with rich data, well-curated visualizations, and skillfully crafted narrative frameworks. Ryan's insider tips take you far beyond the basics--and you'll rely on her expert checklists for years to come.
Communicate more powerfully by applying scientific knowledge of the human brain Get started with the Tableau platform and Tableau Desktop 2022 Connect data and quickly prepare it for analysis Ask questions that help you keep data firmly in context Choose the right charts, graphs, and maps for each project--and avoid the wrong ones Craft storyboards that reflect your message and audience Direct attention to what matters most Build data dashboards that guide people towards meaningful outcomes Master advanced visualizations, including timelines, Likert scales, and lollipop charts
This book has only one prerequisite: your desire to communicate insights from data in ways that are memorable and actionable. It's for executives and professionals sharing important results, students writing reports or presentations, teachers cultivating data literacy, journalists making sense of complex trends. . . . practically everyone! Don't even have Tableau? Download your free trial of Tableau Desktop and let's get started!
179 kr
Läs direkt efter köp
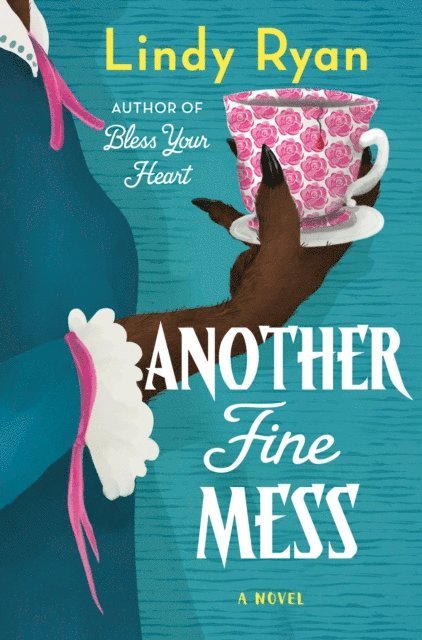
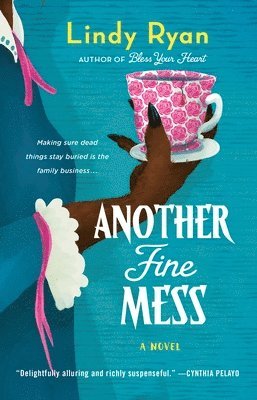
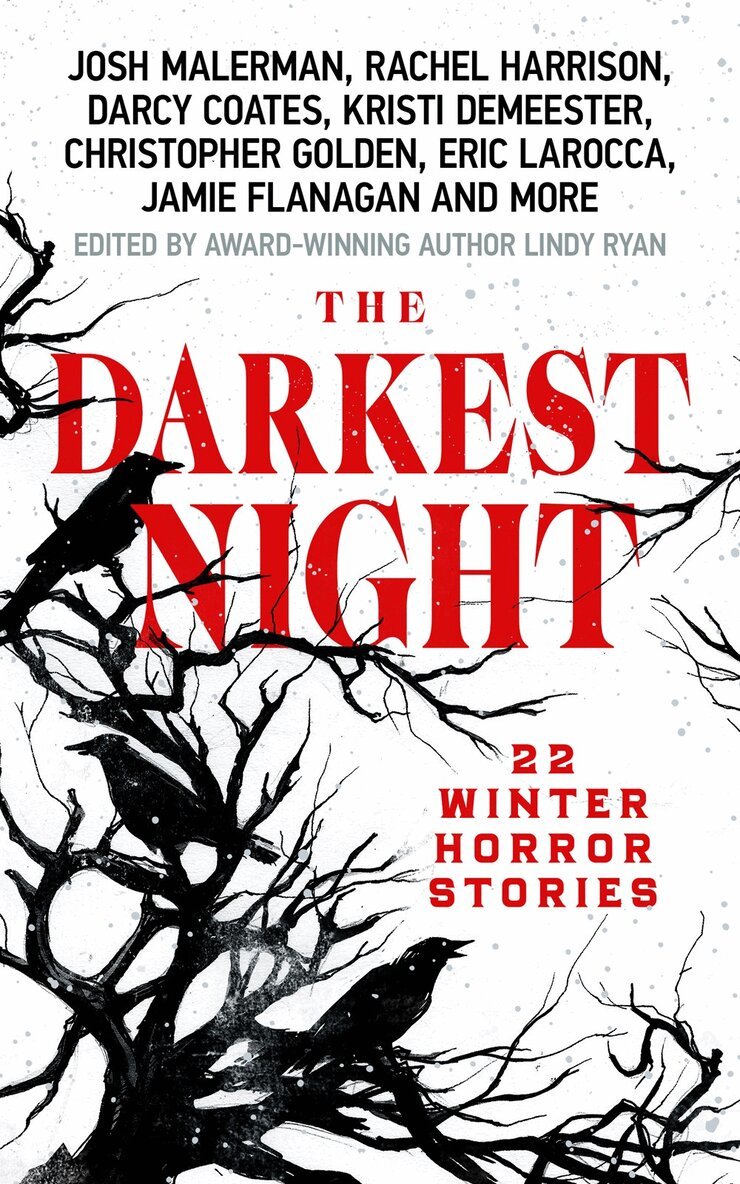
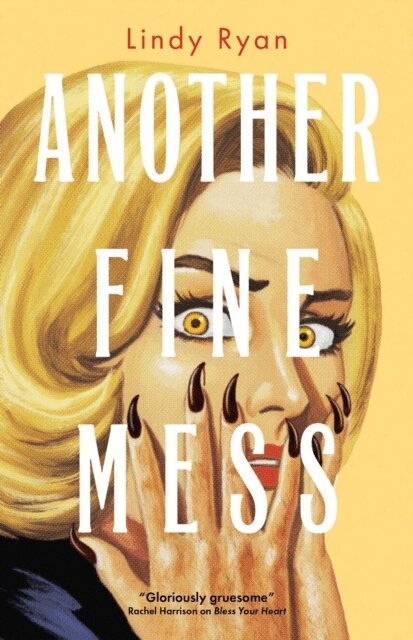
From Lindy Ryan, "one of the most electrifying voices in the horror genre” (Gwendolyn Kiste), Another Fine Mess brings the Evans women back around in this unputdownable, crackling, rollicking mystery of humor, heart, and horror.Making sure dead things stay buried is the family business...For over a hundred years, the Evans women have kept the undead in their strange southeast Texas town from rising. But sometimes the dead rise too quick–and that’s what left Lenore Evans, and her granddaughter Luna, burying Luna’s mother, Grace, and Lenore’s mother, Ducey. Now the only two women left in the Evans family, Luna and Lenore are left rudderless in the wake of the most Godawful Mess to date.But when the full moon finds another victim, it’s clear their trouble is far from over. Now Lenore, Luna, and the new sheriff—their biggest ally—must dig deep down into family lore to uncover what threatens everything they love most. The body count ticks up, the most unexpected dead will rise–forcing Lenore and Luna to face the possibility that the undead aren’t the only monsters preying on their small town.
282 kr
Skickas inom 3-6 vardagar
385 kr
Skickas inom 3-6 vardagar
179 kr
Läs direkt efter köp
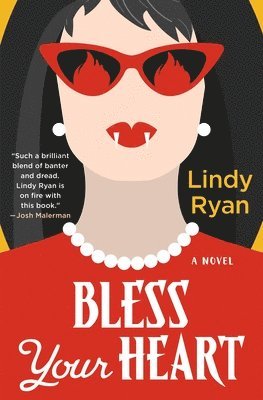
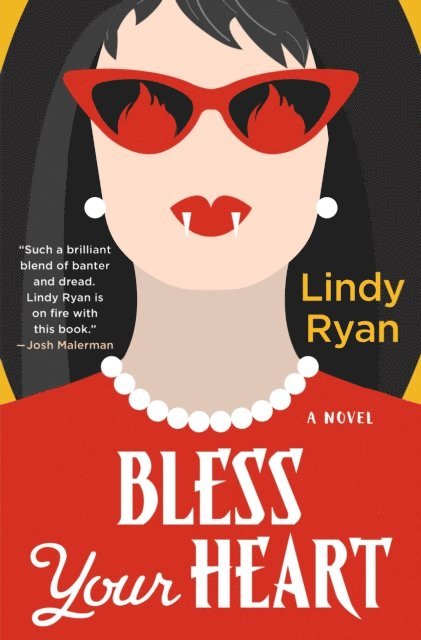
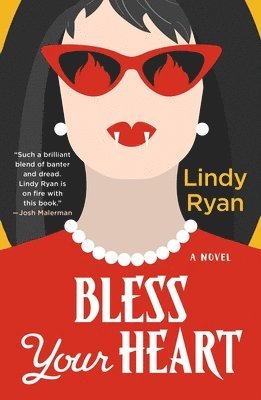
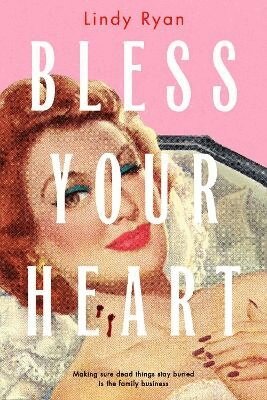
A crackling mystery-horror novel with big-hearted characters and Southern charm with a bite, Bless Your Heart is a gasp-worthy delight from start to finish from debut author Lindy Ryan. Rise and shine. The Evans women have some undead to kill.It’s 1999 in Southeast Texas and the Evans women, owners of the only funeral parlor in town, are keeping steady with…normal business. The dead die, you bury them. End of story. That’s how Ducey Evans has done it for the last eighty years, and her progeny—Lenore the experimenter and Grace, Lenore’s soft-hearted daughter, have run Evans Funeral Parlor for the last fifteen years without drama. Ever since That Godawful Mess that left two bodies in the ground and Grace raising her infant daughter Luna, alone.But when town gossip Mina Jean Murphy’s body is brought in for a regular burial and she rises from the dead instead, it’s clear that the Strigoi—the original vampire—are back. And the Evans women are the ones who need to fight back to protect their town.As more folks in town turn up dead and Deputy Roger Taylor begins asking way too many questions, Ducey, Lenore, Grace, and now Luna, must take up their blades and figure out who is behind the Strigoi’s return. As the saying goes, what rises up, must go back down. But as unspoken secrets and revelations spill from the past into the present, the Evans family must face that sometimes, the dead aren’t the only things you want to keep buried. "A gloriously gruesome, compulsively readable debut that is as grizzly as it is clever and heartfelt." - Rachel Harrison
282 kr
Skickas inom 3-6 vardagar
382 kr
Skickas inom 3-6 vardagar
301 kr
Läs direkt efter köp
247 kr
Kommande
180 kr
Skickas inom 5-8 vardagar
198 kr
Skickas inom 5-8 vardagar
214 kr
Skickas
200 kr
Skickas

161 kr
Skickas
135 kr
Skickas
126 kr
Skickas
126 kr
Skickas
138 kr
Skickas
224 kr
Skickas inom 5-8 vardagar
289 kr
Lyssna direkt efter köp
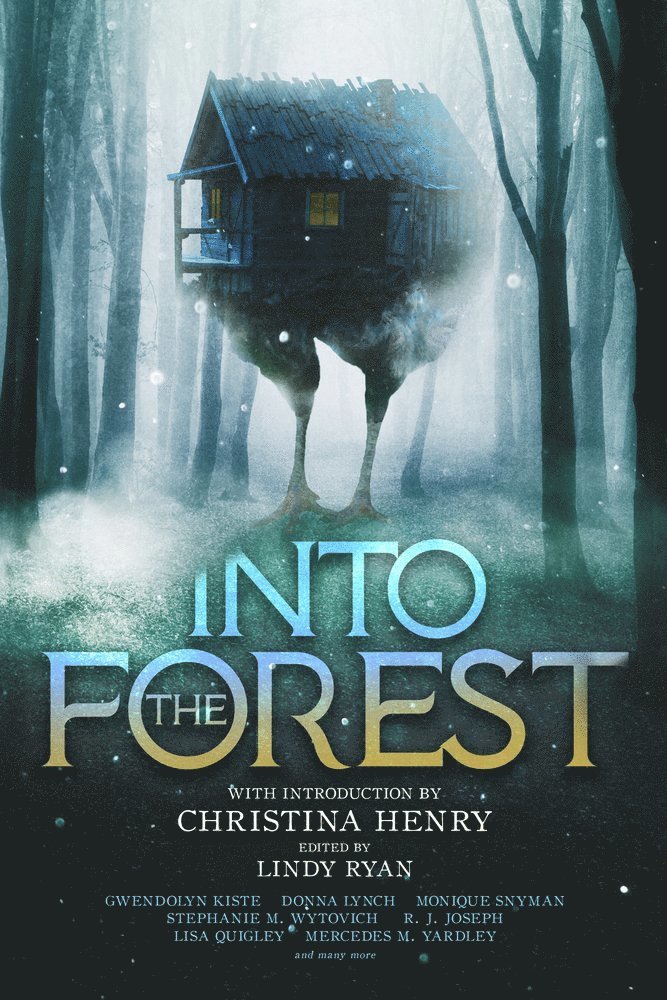
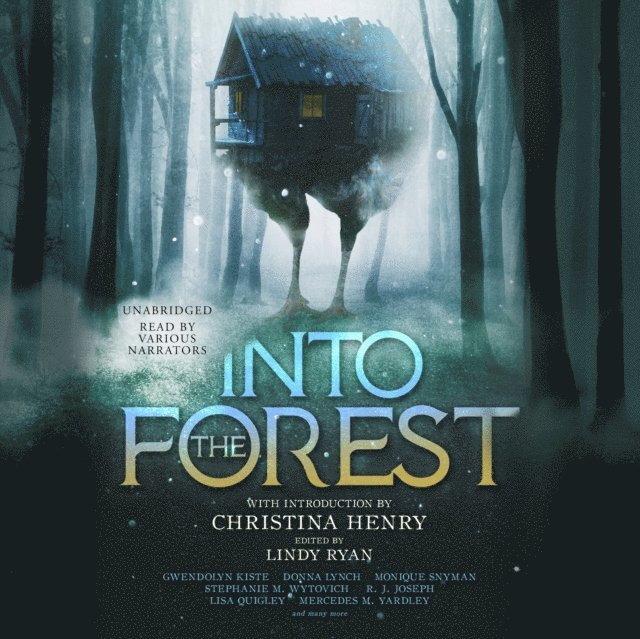
A collection of new and exclusive short stories inspired by the Baba Yaga, featuring Gwendolyn Kiste, Stephanie M. Wytovich, Mercedes M. Yardley, Monique Snyman, Donna Lynch, Lisa Quigley, and R. J. Joseph, with a foreword by Christina Henry.
Deep in the dark forest, in a cottage that spins on birds’ legs behind a fence topped with human skulls, lives the baba yaga. A guardian of the water of life, she lives with her sisters and takes to the skies in a giant mortar and pestle, creating tempests as she goes. Those who come across the baba yaga may find help, or hinderance, or horror. She is wild, she is woman, she is witch—and these are her tales.
Edited by Lindy Ryan, this collection brings together some of today’s leading voices of women-in-horror as they pay tribute to the baba yaga, and go Into the Forest.
237 kr
Tillfälligt slut