• Fri frakt över 249 kr
  • •
  • Snabba leveranser
  • •
  • Billiga böcker
Kundservice

Du är på sajten för privatpersoner.

Företag, bibliotek eller offentlig verksamhet?

Du handlar på classic.bokus.com, där alla dina funktioner finns intakta.
Till classic.bokus.com
Bokus logotyp. Gå till startsidan.
  • Erbjudanden
  • Student
  • Topplistor
  • Barn & ungdom
  • Bokus Play
  • E-böcker
  • Ljudböcker
  • Pocketböcker
  • Spel och pussel

Pocketfynda! Hundratals böcker för 49 kr/st →

Sidfot

Mina sidor

    Hjälp

    • Kundservice
    • Vanliga frågor och svar
    • Frakt och leverans
    • Retur vid ångerrätt
    • Reklamera vara
    • Betalning
    • Köpvillkor
    • Allmänna villkor
    • Information om webbplatsens tillgänglighet

    Om Bokus

    • Om oss
    • Pressrum
    • För studenter
    • För företag
    • För bibliotek och offentlig verksamhet
    • För leverantörer
    • Hållbarhet

    Populärt

    • Aktuella erbjudanden
    • Presentkort
    • Studentlitteratur
    • Nya böcker
    • Topplistor
    • Signerade böcker
    • Engelska böcker

    Inspiration

    • Boktips
    • BookTok
    • Barnbokskaraktärer
    • Populära författare
    Logotyp för Bokus
    Följ oss på Facebook (extern länk)Följ oss på Instagram (extern länk)Följ oss på YouTube (extern länk)Följ oss på TikTok (extern länk)
    bokus @ CookiesAnpassa cookiesIntegritetspolicyKöpvillkor
    Till Citymail hemsida (extern länk)Till Budbee hemsida (extern länk)Till Postnord hemsida (extern länk)Till Schenker hemsida (extern länk)Till Early Bird hemsida (extern länk)Till Walleys hemsida (extern länk)
    1. Medicin
    2. Medicin: allmänt
    3. Hälso- och sjukvård

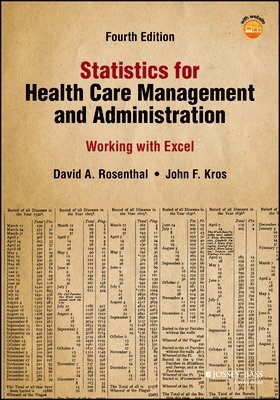
    Statistics for Health Care Management and Administration

    Working with Excel

    AvDavid A. Rosenthal,John F. Kros

    Häftad, Engelska, 2023

    Del i serien Public Health/Epidemiology and Biostatistics

    1 119 kr

    Beställningsvara. Skickas inom 5-8 vardagar. Fri frakt över 249 kr.

    Fler format och utgåvor

    E-bok

    1 543 kr

    E-bok

    1 560 kr

    Beskrivning

    The must-have statistics guide for students of health services Statistics for Health Care Management and Administration: Working with Excel introduces the uses of statistics in healthcare management and administration using the features and functions of Microsoft Excel. The book introduces students to statistics within the context of health care, focusing on the major data and analysis techniques used in the field. Step-by-step instructions in the latest version of Excel and numerous annotated screen shots make examples easy to follow and understand. This updated fourth edition provides the same content and explanations that have made the previous editions so popular, offering revisions drawn directly from universities where the book has been used. All content has been brought current with the newest version of excel, and changes in the field of healthcare administration are covered as well. Statistics for Health Care Management and Administration gets students off to a great start by introducing statistics in the context of their chosen field. Learn the basics of statistics in the context of ExcelUnderstand how to acquire data and display it for analysisMaster important concepts and tests, including regressionTurn test results into usable information with proper analysisThis book not only helps students develop the necessary data analysis skills, but also boosts familiarity with important software that employers will be looking for.

    Produktinformation

    • Utgivningsdatum:2023-10-26
    • Mått:178 x 246 x 33 mm
    • Vikt:816 g
    • Format:Häftad
    • Språk:Engelska
    • Serie:Public Health/Epidemiology and Biostatistics
    • Antal sidor:560
    • Upplaga:4
    • Förlag:John Wiley & Sons Inc
    • ISBN:9781119901679

    Utforska kategorier

    • Hälso- och sjukvård inom Medicin
    • Affärsapplikationer inom Data och IT

    Mer om författaren

    David A. Rosenthal is a Chief Information Officer at CampusWorks, Inc. He has over 20 years of health care industry experience in both academic and practitioner settings, having served in roles specific to hospital information technology leadership, multispecialty practice administration, and ambulatory services project management. Rosenthal earned a Master of Public Administration degree from Valdosta State University, and a PhD in Technology Management from Indiana State University. David is a proud veteran of the U.S. Air Force, and resides in Oakland, Tennessee with his wife Allyson. John F. Kros is the Vincent K. McMahon Distinguished Professor in the Marketing and Supply Chain Management Department in the College of Business at East Carolina University, in Greenville, North Carolina. He teaches business decision modeling, statistics, operations and supply chain management, and purchasing and materials management courses. Kros was honored as the College of Business’s Scholar/Teacher for 2004???2005, again in 2009???2010, was awarded the College of Business Commerce Club’s highest honor, the Teaching Excellence Award, for 2006 and again in 2011, in 2013???2014 was awarded the East Carolina Alumni Association Outstanding Teaching Award, and in 2014???2015 was awarded the Board of Governors Distinguished Professor for Teaching Award. Kros earned his PhD in systems engineering from the University of Virginia, his MBA from Santa Clara University, and his BBA from the University of Texas at Austin. His research interests include health care operations, applied statistics, design of experiments, multi-objective decision making, Taguchi methods, and applied decision analysis. His textbook titled Spreadsheet Modeling for Business Decisions is in the fifth edition. He is also coauthor of Health Care Operations and Supply Chain Management.

    Innehållsförteckning

    • Preface xiiiIntroducing Excel xiiiSo How Did We Get to Here? xiiiIntended Level of the Textbook xivTextbook Organization xivLeading by Example(s) xvAcknowledgments xviiThe Authors xixAbout the Companion Website xxiPart 1 1Chapter 1 Statistics and Excel 31.1 How This Book Differs from Other Statistics Texts 31.2 Statistical Applications in Health Policy and Health Administration 4Exercises for Section 1.2 141.3 What Is the ‘‘Big Picture’’? 151.4 Some Initial Definitions 16Exercises for Section 1.4 261.5 Five Statistical Tests 28Exercises for Section 1.5 30Chapter 2 Excel as a Statistical Tool 332.1 The Basics 33Exercises for Section 2.1 352.2 Working and Moving Around in a Spreadsheet 36Exercises for Section 2.2 412.3 Excel Functions 41Exercises for Section 2.3 462.4 The =IF() Function 47Exercises for Section 2.4 502.5 Excel Graphs 51Exercises for Section 2.5 562.6 Sorting a String of Data 57Exercise for Section 2.6 602.7 The Data Analysis Pack 612.8 Functions That Give Results in More than One Cell 63Exercises for Section 2.8 662.9 The Dollar Sign ($) Convention for Cell References 67Chapter 3 Data Acquisition: Sampling and Data Preparation 713.1 The Nature of Data 71Exercises for Section 3.1 783.2 Sampling 79Exercises for Section 3.2 933.3 Data Access and Preparation 94Exercises for Section 3.3 1073.4 Missing Data 108Chapter 4 Data Display: Descriptive Presentation, Excel Graphing Capability 1114.1 Creating, Displaying, and Understanding Frequency Distributions 111Exercises for Section 4.1 1294.2 Using the Pivot Table to Generate Frequencies of Categorical Variables 131Exercises for Section 4.2 1354.3 A Logical Extension of the Pivot Table: Two Variables 135Exercises for Section 4.3 140Chapter 5 Basic Concepts of Probability 1415.1 Some Initial Concepts and Definitions 141Exercises for Section 5.1 1505.2 Marginal Probabilities, Joint Probabilities, and Conditional Probabilities 150Exercises for Section 5.2 1605.3 Binomial Probability 161Exercises for Section 5.3 1715.4 The Poisson Distribution 173Exercises for Section 5.4 1785.5 The Normal Distribution 178Chapter 6 Measures of Central Tendency and Dispersion: Data Distributions 1836.1 Measures of Central Tendency and Dispersion 183Exercises for Section 6.1 1966.2 The Distribution of Frequencies 197Exercises for Section 6.2 2086.3 The Sampling Distribution of the Mean 209Exercises for Section 6.3 2196.4 Mean and Standard Deviation of a Discrete Numerical Variable 220Exercises for Section 6.4 2226.5 The Distribution of a Proportion 222Exercises for Section 6.5 2276.6 The t Distribution 227Exercises for Section 6.6 232Part 2 235Chapter 7 Confidence Limits and Hypothesis Testing 2377.1 What Is a Confidence Interval? 237Exercises for Section 7.1 2437.2 Calculating Confidence Limits for Multiple Samples 244Exercises for Section 7.2 2467.3 What Is Hypothesis Testing? 247Exercises for Section 7.3 2497.4 Type I and Type II Errors 250Exercises for Section 7.4 2667.5 Selecting Sample Sizes 267Exercises for Section 7.5 269Chapter 8 Statistical Tests for Categorical Data 2718.1 Independence of Two Variables 271Exercises for Section 8.1 2828.2 Examples of Chi-Square Analyses 283Exercises for Section 8.2 2898.3 Small Expected Values in Cells 290Exercises for Section 8.3 292Chapter 9 t Tests for Related and Unrelated Data 2959.1 What Is a t Test? 295Exercises for Section 9.1 3029.2 A t Test for Comparing Two Groups 303Exercises for Section 9.2 3169.3 A t Test for Related Data 318Exercises for Section 9.3 321Chapter 10 Analysis of Variance 32310.1 One-Way Analysis of Variance 323Exercises for Section 10.1 33910.2 ANOVA for Repeated Measures 340Exercises for Section 10.2 34810.3 Factorial Analysis of Variance 349Exercises for Section 10.3 362Chapter 11 Simple Linear Regression 36511.1 Meaning and Calculation of Linear Regression 365Exercises for Section 11.1 37311.2 Testing the Hypothesis of Independence 374Exercises for Section 11.2 38011.3 The Excel Regression Add-In 381Exercises for Section 11.3 38811.4 The Importance of Examining the Scatterplot 38811.5 The Relationship between Regression and the t Test 391Exercises for Section 11.5 392Chapter 12 Multiple Regression: Concepts and Calculation 39512.1 Introduction 395Exercises for Section 12.1 406Chapter 13 Extensions of Multiple Regression 40913.1 Dummy Variables in Multiple Regression 409Exercises for Section 13.1 42013.2 The Best Regression Model 421Exercises for Section 13.2 43113.3 Correlation and Multicolinearity 432Exercises for Section 13.3 43513.4 Nonlinear Relationships 435Exercises for Section 13.4 447Chapter 14 Analysis with a Dichotomous Categorical Dependent Variable 44914.1 Introduction to the Dichotomous Dependent Variable 45014.2 An Example with a Dichotomous Dependent Variable: Traditional Treatments 451Exercises for Section 14.2 46214.3 Logit for Estimating Dichotomous Dependent Variables 463Exercises for Section 14.3 47514.4 A Comparison of Ordinary Least Squares, Weighted Least Squares, and Logit 476Exercises for Section 14.4 480Appendix A Multiple Regression and Matrices 481An Introduction to Matrix Math 481Addition and Subtraction of Matrices 482Multiplication of Matrices 483Matrix Multiplication and Scalars 484Finding the Determinant of a Matrix 484Matrix Capabilities of Excel 486Explanation of Excel Output Displayed with Scientific Notation 489Using the b Coefficients to Generate Regression Results 490Calculation of All Multiple Regression Results 491Exercises for Appendix A 494References 497Glossary 499Index 513