Robert A. Stine – författare
Visar alla böcker från författaren . Handla med fri frakt och snabb leverans.
8 produkter
8 produkter
Häftad, Engelska, 1998
497 kr
Skickas
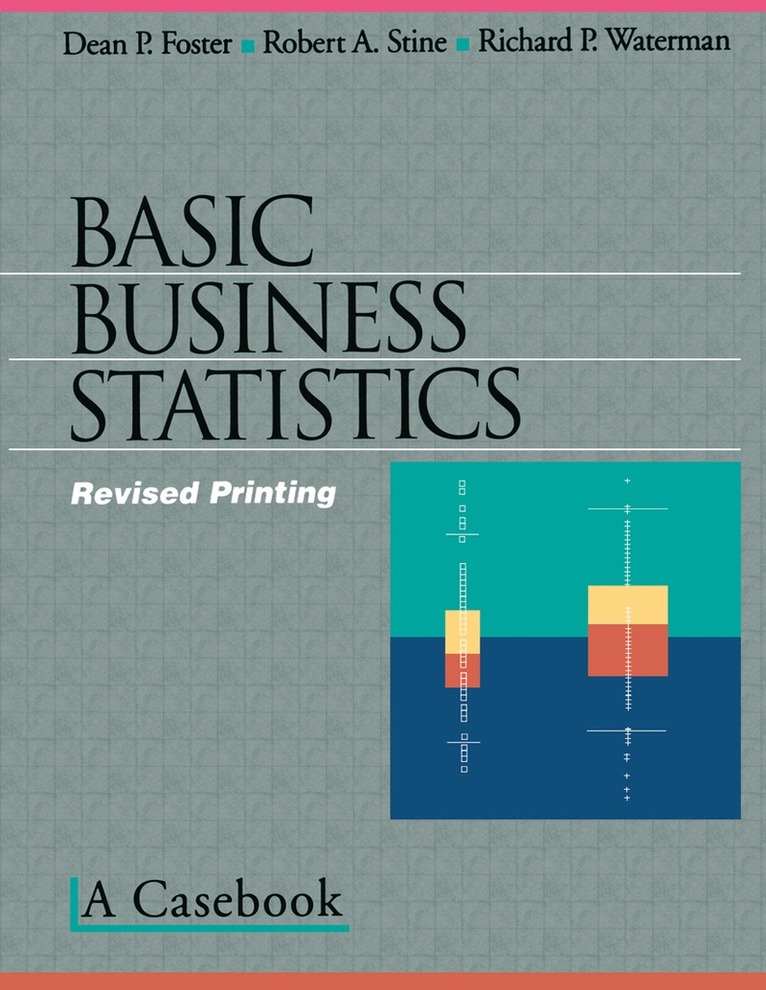
Preface Statistics is seldom the most eagerly anticipated course of a business student. It typically has the reputation of being a boring, complicated, and confusing mix of mathematical formulas and computers. Our goal in writing this casebook and the companion volume (Business Analysis Using Regression) was to change that impression by showing how statistics yields insights and answers interesting business questions. Rather than dwell on underlying formulas, we show how to use statistics to answer questions. Each case study begins with a business question and concludes with an answer to that question. Formulas appear only as needed to address the questions, and we focus on the insights into the problem provided by the mathematics. The mathematics serves a purpose. The material in this casebook is organized into 11 "classes" of related case studies that develop a single, key idea of statistics. The analysis of data using statistics is seldom very straightforward, and each analysis has many nuances. Part of the appeal of statistics is this richness, this blending of substantive theories and mathematics. For newcomers, however, this blend is too rich, and they are easily overwhelmed and unable to sort out the important ideas from nuances. Although later cases in these notes suggest this complexity, we do not begin that way.
Häftad, Engelska, 1998
1 082 kr
Skickas inom 10-15 vardagar
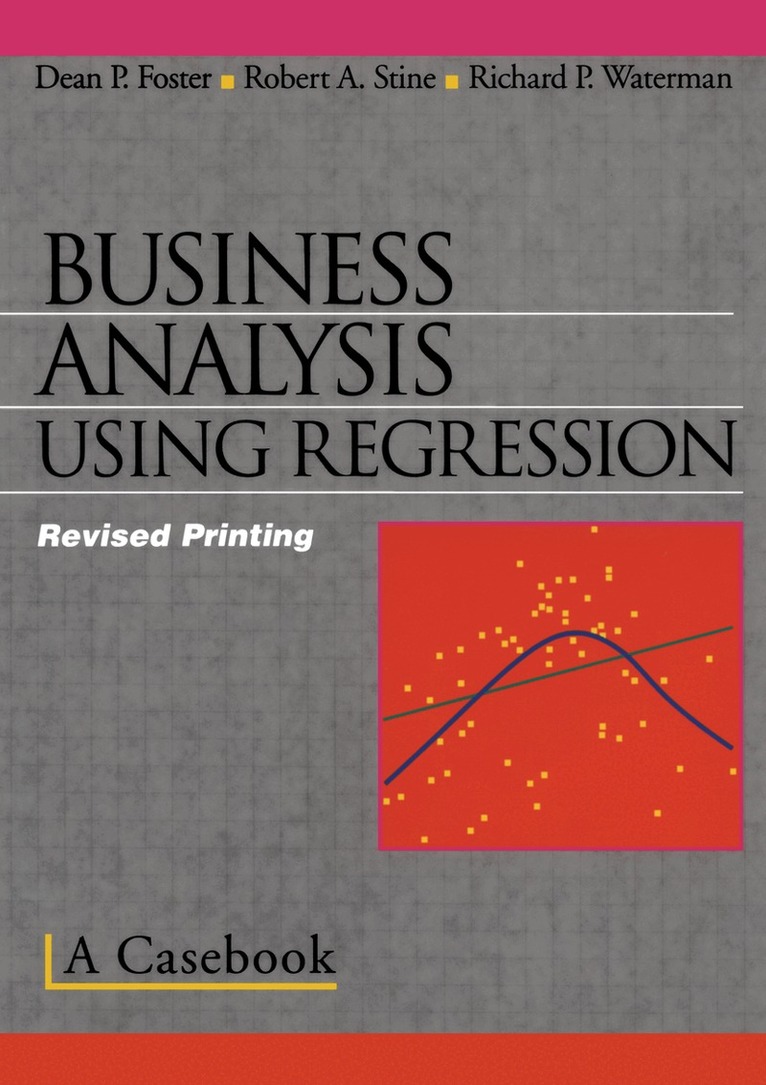
Preface Statistics is seldom the most eagerly anticipated course of a business student. It typically has the reputation ofbeing aboring, complicated, and confusing mix of mathematical formulas and computers. Our goal in writing this casebook and the companion volume (Basic Business Statistics) was to change that impression by showing how statistics gives insights and answers interesting business questions. Rather than dwell on underlying formulas, we show how to use statistics to answer questions. Each case study begins with a business question and concludes with an answer. Formulas appear only as needed to address the questions, and we focus on the insights into the problem provided by the mathematics. The mathematics serves a purpose. The material is organized into 12 "classes" of related case studies that develop a single, key idea of statistics. The analysis of data using statistics is seldom very straightforward, and each analysis has many nuances. Part ofthe appeal ofstatistics is this richness, this blending of substantive theories and mathematics. For a newcomer, however, this blend is too rich and they are easily overwhelmed and unable to sort out the important ideas from nuances. Although later cases in these notes suggest this complexity, we do not begin that way. Each class has one main idea, something big like standard error. We begin a class by discussing an application chosen to motivate this key concept, and introduce the necessary terminology.
Inbunden, Engelska, 1996
2 626 kr
Skickas inom 3-6 vardagar
The nature of statistics has changed from classical notions of hypothesis testing toward graphical and exploratory data analysis that exploits the flexibility of interactive computing and graphical displays. With contributions from some of the leading researchers in the social sciences and statistics, Statistical Computing Environments for Social Research describes seven statistical computing environments--APL2STAT, GAUSS, Lisp-Stat, Mathematica, S, SAS/IML, and Stata--that can be used effectively in graphical and exploratory modeling. These statistical computing environments, in contrast to a standard statistical package, provide programming tools for building other statistical applications. Programmability, flexible data structures, and--in the case of some of the computing environments--graphical interfaces and object-oriented programming permit researchers to take advantage of emerging statistical methodologies. Three additional chapters, describing the Axis, R-code, and ViSta statistical packages, demonstrate how researchers have extended one of the computing environments--Lisp-Stat--to produce significant statistical applications employing graphical interfaces to statistical software. To illustrate the capabilities of the seven statistical computing environments, each contributor uses the same data set to perform three computing tasks: robust regression, bootstrap resampling, and kernel-density estimation. The same data are analyzed in the chapters on Axis, R-code, and ViSta packages. The chapters in Statistical Computing Environments for Social Research illustrate important ideas and techniques in modern data analysis and statistical computing, ideas and techniques that readers will be able to apply in the more effective analysis of their own data.
Häftad, Engelska, 1996
1 777 kr
Skickas inom 3-6 vardagar
The nature of statistics has changed from classical notions of hypothesis testing toward graphical and exploratory data analysis that exploits the flexibility of interactive computing and graphical displays. With contributions from some of the leading researchers in the social sciences and statistics, Statistical Computing Environments for Social Research describes seven statistical computing environments--APL2STAT, GAUSS, Lisp-Stat, Mathematica, S, SAS/IML, and Stata--that can be used effectively in graphical and exploratory modeling. These statistical computing environments, in contrast to a standard statistical package, provide programming tools for building other statistical applications. Programmability, flexible data structures, and--in the case of some of the computing environments--graphical interfaces and object-oriented programming permit researchers to take advantage of emerging statistical methodologies. Three additional chapters, describing the Axis, R-code, and ViSta statistical packages, demonstrate how researchers have extended one of the computing environments--Lisp-Stat--to produce significant statistical applications employing graphical interfaces to statistical software. To illustrate the capabilities of the seven statistical computing environments, each contributor uses the same data set to perform three computing tasks: robust regression, bootstrap resampling, and kernel-density estimation. The same data are analyzed in the chapters on Axis, R-code, and ViSta packages. The chapters in Statistical Computing Environments for Social Research illustrate important ideas and techniques in modern data analysis and statistical computing, ideas and techniques that readers will be able to apply in the more effective analysis of their own data.
E-bok
PDF, Engelska, 2014797 kr
Läs direkt efter köp
E-bok
PDF, Engelska, 20121 393 kr
Läs direkt efter köp
Preface Statistics is seldom the most eagerly anticipated course of a business student. It typically has the reputation ofbeing aboring, complicated, and confusing mix of mathematical formulas and computers. Our goal in writing this casebook and the companion volume (Basic Business Statistics) was to change that impression by showing how statistics gives insights and answers interesting business questions. Rather than dwell on underlying formulas, we show how to use statistics to answer questions. Each case study begins with a business question and concludes with an answer. Formulas appear only as needed to address the questions, and we focus on the insights into the problem provided by the mathematics. The mathematics serves a purpose. The material is organized into 12 "classes" of related case studies that develop a single, key idea of statistics. The analysis of data using statistics is seldom very straightforward, and each analysis has many nuances. Part ofthe appeal ofstatistics is this richness, this blending of substantive theories and mathematics. For a newcomer, however, this blend is too rich and they are easily overwhelmed and unable to sort out the important ideas from nuances. Although later cases in these notes suggest this complexity, we do not begin that way. Each class has one main idea, something big like standard error. We begin a class by discussing an application chosen to motivate this key concept, and introduce the necessary terminology.
E-bok
PDF, Engelska, 20121 179 kr
Läs direkt efter köp
Preface Statistics is seldom the most eagerly anticipated course of a business student. It typically has the reputation of being a boring, complicated, and confusing mix of mathematical formulas and computers. Our goal in writing this casebook and the companion volume (Business Analysis Using Regression) was to change that impression by showing how statistics yields insights and answers interesting business questions. Rather than dwell on underlying formulas, we show how to use statistics to answer questions. Each case study begins with a business question and concludes with an answer to that question. Formulas appear only as needed to address the questions, and we focus on the insights into the problem provided by the mathematics. The mathematics serves a purpose. The material in this casebook is organized into 11 "classes" of related case studies that develop a single, key idea of statistics. The analysis of data using statistics is seldom very straightforward, and each analysis has many nuances. Part of the appeal of statistics is this richness, this blending of substantive theories and mathematics. For newcomers, however, this blend is too rich, and they are easily overwhelmed and unable to sort out the important ideas from nuances. Although later cases in these notes suggest this complexity, we do not begin that way.
E-bok
PDF, Engelska, 2013902 kr
Läs direkt efter köp