• Fri frakt över 249 kr
  • •
  • Snabba leveranser
  • •
  • Billiga böcker
Kundservice

Du är på sajten för privatpersoner.

Företag, bibliotek eller offentlig verksamhet?

Du handlar på classic.bokus.com, där alla dina funktioner finns intakta.
Till classic.bokus.com
Bokus logotyp. Gå till startsidan.
  • Erbjudanden
  • Student
  • Topplistor
  • Barn & ungdom
  • Bokus Play
  • E-böcker
  • Ljudböcker
  • Pocketböcker
  • Spel och pussel

Pocketfynda! Hundratals böcker för 49 kr/st →

Sidfot

Mina sidor

    Hjälp

    • Kundservice
    • Vanliga frågor och svar
    • Frakt och leverans
    • Retur vid ångerrätt
    • Reklamera vara
    • Betalning
    • Köpvillkor
    • Allmänna villkor
    • Information om webbplatsens tillgänglighet

    Om Bokus

    • Om oss
    • Pressrum
    • För studenter
    • För företag
    • För bibliotek och offentlig verksamhet
    • För leverantörer
    • Hållbarhet

    Populärt

    • Aktuella erbjudanden
    • Presentkort
    • Studentlitteratur
    • Nya böcker
    • Topplistor
    • Signerade böcker
    • Engelska böcker

    Inspiration

    • Boktips
    • BookTok
    • Barnbokskaraktärer
    • Populära författare
    Logotyp för Bokus
    Följ oss på Facebook (extern länk)Följ oss på Instagram (extern länk)Följ oss på YouTube (extern länk)Följ oss på TikTok (extern länk)
    bokus @ CookiesAnpassa cookiesIntegritetspolicyKöpvillkor
    Till Citymail hemsida (extern länk)Till Budbee hemsida (extern länk)Till Postnord hemsida (extern länk)Till Schenker hemsida (extern länk)Till Early Bird hemsida (extern länk)Till Walleys hemsida (extern länk)
    1. Ekonomi och Ledarskap
    2. Ledarskapsböcker
    3. Projektledning

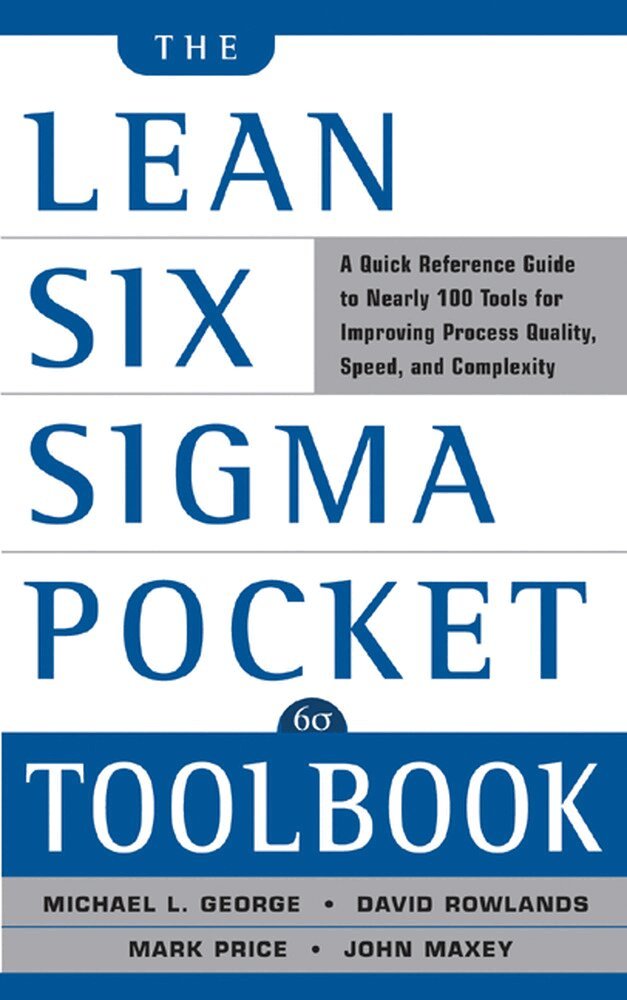
    Lean Six Sigma Pocket Toolbook: A Quick Reference Guide to Nearly 100 Tools for Improving Quality and Speed

    AvMichael George,David Rowlands

    Häftad, Engelska, 2004

    238 kr

    Beställningsvara. Skickas inom 3-6 vardagar. Fri frakt över 249 kr.

    Beskrivning

    Vital tools for implementing Lean Six Sigma--what they are, how they work, and which to use

    The Lean Six Sigma Pocket Toolbook is today's most complete and results-based reference to the tools and concepts needed to understand, implement, and leverage Lean Six Sigma. The only guide that groups tools by purpose and use, this hands-on reference provides:

    • Analyses of nearly 100 tools and methodologies--from DMAIC and Pull Systems to Control Charts and Pareto Charts
    • Detailed explanations of each tool to help you know how, when, and why to use it for maximum efficacy
    • Sections for each tool explaining how to create it, how to interpret what you find, and expert tips

    Lean Six Sigma is today's leading technique to maximize production efficiency and maintain control over each step in the managerial process. With The Lean Six Sigma Pocket Toolbook, you'll discover how to propel your organization to new levels of competitive success--one tool at a time.

    Produktinformation

    • Utgivningsdatum:2004-08-16
    • Mått:126 x 203 x 19 mm
    • Vikt:300 g
    • Format:Häftad
    • Språk:Engelska
    • Antal sidor:288
    • Förlag:McGraw-Hill Education
    • ISBN:9780071441193

    Utforska kategorier

    • Projektledning inom Ekonomi och Ledarskap

    Mer om författaren

    McGraw-Hill authors represent the leading experts in their fields and are dedicated to improving the lives, careers, and interests of readers worldwide McGraw-Hill authors represent the leading experts in their fields and are dedicated to improving the lives, careers, and interests of readers worldwide Richard Leifer, Christopher M. McDermott, Gina Colarelli O’Connor, Lois S. Peters, Mark Rice and Robert W. Veryzer are all faculty members in the Lally School of Management and Technology, Rensselaer Polytechnic Institute. McGraw-Hill authors represent the leading experts in their fields and are dedicated to improving the lives, careers, and interests of readers worldwide

    Innehållsförteckning

    • Chapter 1: Using DMAIC to Improve Speed, Quality, and Cost Define Measure Analyze Improve Control Kaizen DMAIC Project selection Chapter 2: Working With Ideas Brainstorming Affinity diagrams Multivoting Chapter 3: Value Stream Mapping and Process Flow Tools Process mapping Process observation SIPOC Process mapping steps Transportation and spaghetti (workflow) diagrams Swim-lane (deployment) flowcharts Value stream maps (basic) Flowchart and value stream symbols Value-add (VA) vs. non-value-add (NVA) analysis Time value maps Value-add chart (task time or takt time chart) Chapter 4: Voice of the Customer (VOC) Customer segmentation Sources of customer data Collecting VOC: Interviews Collecting VOC: Point-of-use observation Collecting VOC: Focus groups Collecting VOC: Surveys Kano analysis Developing critical-to-quality requirements Chapter 5: Data Collection Types of data Input vs. output data Data collection planning Measurement selection matrix Stratification factors Operational definitions Cautions on using existing data Making a checksheet Basic checksheets Frequency plot checksheet Traveler checksheet Location checksheet Sampling basics Factors in sample selection Stable process (and population) sampling Formulas for determining minimum sample size (population or stable process) Measurement System Analysis (MSA) and Gage R&R Overview Gage R&R: Collecting the data Interpreting Gage R&R Results MSA: Evaluating bias MSA: Evaluating stability MSA: Evaluating discrimination MSA for attribute/discrete data Chapter 6: Descriptive Statistics and Data Displays Statistical term conventions Measures of central tendency (mean, median, mode) Measures of spread (range, variance, standard deviation) Boxplots Frequency plot (histogram Normal distribution Non-normal distributions and the Central Limit Theorem Chapter 7: Variation Analysis Review of variation concepts Time series plots (Run charts) Run chart table Control chart basics Selecting a control chart Control charts for continuous data Subgrouping for continuous data Control limit formulas for continuous data Factors for Control Chart Formulas Creating an ImR Chart Creating X,R charts or X,S charts Control charts for attribute data Creating p-, np-, c-, and u-charts Control limit formulas for attribute data Assumptions for interpreting control charts Interpreting control charts (Tests for Special Cause Variation) Background on process capability calculations Confusion in short-term vs. long-term process capability calculations Calculating process capability Chapter 8: Identifying and Verifying Causes PART A: Identifying potential causes Pareto charts 5 Whys Cause-and-effect diagrams (fishbone or Ishikawa diagrams) C&E Matrix PART B: Tools for confirming causal effects Stratified data charts Testing quick fixes or obvious solutions Scatter plots Hypothesis testing overview Confidence intervals Type I and Type II errors, Confidence, Power, and p-values Confidence intervals and sample size t–test Overview 1-Sample t-test 2-Sample t-test Overview of correlation Correlation statistics (coefficients) Regression overview Simple linear regression Multiple regression ANOVA (ANalysis Of VAriance) One-way ANOVA Degrees of Freedom ANOVA assumptions Two-way ANOVA Chi-Square test Design of Experiments (DOE) notation and terms Planning a designed experiment DOE: Full-factorial vs. Fractional-factorials (and notations) Interpreting DOE results Chapter 9: Reducing Lead Time and Non-Value-Add Cost Basic Lean concepts Metrics of time efficiency Time Traps vs. Capacity Constraints Identifying Time Traps and Capacity Constraints 5S Overview Implementing 5S Generic Pull System Replenishment Pull Systems Two-Bin Replenishment System Computing minimum safe batch sizes Four Step Rapid Setup Method Adapting Four Step Rapid Setup for service processes Total Productive Maintenance (TPM) Mistake proofing & prevention (Poka-yoke) Process balancing design principles Work cell optimization Visual Process Controls Chapter 10: Complexity Value Stream Mapping and Complexity Analysis Product/service family grid Complexity Value Stream Map (CVSM) Process Cycle Efficiency (PCE) The Complexity Equation Complexity matrix PCE destruction calculations (for a Complexity Matrix) Substructure analysis “What-if” analyses with Complexity Matrix data Chapter 11: Selecting and Testing Solutions Sources of solution ideas Benchmarking Tips on solution selection Developing and using evaluation criteria Solution selection matrix Pairwise ranking Cost evaluation Impact/effort matrix Pugh matrix Other evaluation techniques Controls assessment matrix Failure Modes and Effects Analysis (FMEA) Pilot testing Index

    Betyg & recensioner

    2/5