
Deirdre A. Gaquin – författare
Visar alla böcker från författaren Deirdre A. Gaquin. Handla med fri frakt och snabb leverans.
22 produkter
22 produkter
E-bok
PDF, Engelska, 20131 547 kr
Läs direkt efter köp
Race and Employment in America: 2013, First EditionThis Bernan Press first edition contains a convenient selection of information from the Census Bureau’s Equal Employment Opportunity (EEO) tabulation. Based on the American Community Survey, the EEO tabulation highlights the diversity of the labor force and serves as the primary external benchmark for comparing the race, ethnicity, and sex composition of an organization''s internal workforce, and the analogous external labor market, within a specified geography and job category. Essential for any economic development official, EEO specialist, regional planner, urban researcher, or college student, Race and Employment in America answers questions about the direction of the workforce in America by race and the professions that America’s races are choosing. Occupations are displayed by individual states and metropolitan areas. Race and Employment in America is one of the most comprehensive printed publications on the civilian labor force by race. Researchers, college students, and data users can easily see the trends of the job market that are affecting the nation today. This edition includes: A complete listing of detailed occupation data for the nation, by race, sex, and Hispanic originListings of job categories by race, sex, and Hispanic origin for all states and metropolitan areasDetailed list of the EEO tabulation’s occupations, including job descriptions and SOC occupation codesOccupation profiles for each race and Hispanic origin group, showing fifteen occupation groups ranked by the number of workers and the ten most selected detailed occupations of each sex, race, and Hispanic origin group figures showing visual images of the civilian labor force, by raceEducational attainment data by race, sex, Hispanic origin, and selected age groupsEducational attainment level by race, sex, and Hispanic origin for detailed occupations Race and Employment in America is a valuable addition for all academic and public libraries.Race and Employment in America: 2013 is great companion to Employment, Hours, and Earnings, and the Occupational Outlook Handbook available from Bernan Press. Other Bernan research and reference books include:County and City Extra: Annual Metro, City, and County Data BookThe Who, What, and Where of America: Understanding the American Community SurveyPlaces, Towns, and Townships
E-bok
PDF, Engelska, 20151 570 kr
Läs direkt efter köp
Families in America presents a wide selection of information from the American Community Survey that helps us describe American living arrangements, relationships, marriages, births, children, and incomes. Each section includes a large selection of information for the United States, the 50 states, and the District of Columbia. This is followed by a more limited selection of data for 381 metropolitan areas, 980 counties with populations of 50,000 or more, and 795 cities with populations of 50,000 or more.Families in America includes details about both family and nonfamily households and includes topics such as multi-generational households, same-sex partner households, grandchildren living with grandparents, and nonrelatives in family households. In addition, information related to age, sex, race, Hispanic origin, income, poverty, and health insurance for various household types is included.
Inbunden, Engelska, 2015
1 950 kr
Skickas inom 10-15 vardagar
County and City Extra, Special Historical Edition brings together data from the earliest days of our nation through 2010. For more than 20 years, the County and City Extra series has provided annual up-to-date statistical information for every state, county, metropolitan area, and congressional district, as well as all cities with populations of 25,000 or more. Part A provides an overview with selected national data for all available years from the Census Bureau, the Bureau of Labor Statistics, and the Bureau of Economic AnalysisPart B includes a similar selection of data for the 50 states and the District of Columbia.Part C shows the population of each county from the date of its origins through the 2010 census. Detailed information about the origins of all states and counties is includedPart D presents the largest cities for each of the 23 censuses between 1790 and 2010, as well as a table showing the historical populations of all cities with populations of 100,000 or more in 2010. In addition to Parts A, B, C, and D, a section titled "The United States through the Decades" is included highlighting important events in the United States in each decade from 1790 to 2010.This edition also includes several figures on topics such as population growth through the decades, foreign-born residents, fastest-growing counties from 1790 to 2010, life expectancy through the years, and per capita income. Some interesting facts found in County and City Extra: Special Historical Edition include:In 1790, Virginia was the most populous state with over 800,000 residents (including territories that are now West Virginia and Kentucky)Between the first Census and the Civil War, the U.S population grew by more than 30 percent each decadeIn 1870, only 3 percent of U.S. residents were 65 years old and over. With increased life expectancy and lower birth rates, the proportion had grown to 13 percent by 2010.The 1900 census showed that Wyoming, Montana, and Nevada had 150 men for every 100 women. In 2010, the ratio was 96.7 men for every 100 women at the national level.Mississippi had the lowest per-capita income throughout the 80-year time period between 1930 and 2010.From 1910 to 1920, Los Angeles experienced growth from Hollywood’s dominance in the film industry. Its population increased by 81 percent that decade and its land area more than tripled.
E-bok
PDF, Engelska, 20152 088 kr
Läs direkt efter köp
County and City Extra, Special Historical Edition brings together data from the earliest days of our nation through 2010. For more than 20 years, the County and City Extra series has provided annual up-to-date statistical information for every state, county, metropolitan area, and congressional district, as well as all cities with populations of 25,000 or more. Part A provides an overview with selected national data for all available years from the Census Bureau, the Bureau of Labor Statistics, and the Bureau of Economic AnalysisPart B includes a similar selection of data for the 50 states and the District of Columbia.Part C shows the population of each county from the date of its origins through the 2010 census. Detailed information about the origins of all states and counties is includedPart D presents the largest cities for each of the 23 censuses between 1790 and 2010, as well as a table showing the historical populations of all cities with populations of 100,000 or more in 2010. In addition to Parts A, B, C, and D, a section titled "The United States through the Decades" is included highlighting important events in the United States in each decade from 1790 to 2010.This edition also includes several figures on topics such as population growth through the decades, foreign-born residents, fastest-growing counties from 1790 to 2010, life expectancy through the years, and per capita income. Some interesting facts found in County and City Extra: Special Historical Edition include:In 1790, Virginia was the most populous state with over 800,000 residents (including territories that are now West Virginia and Kentucky)Between the first Census and the Civil War, the U.S population grew by more than 30 percent each decadeIn 1870, only 3 percent of U.S. residents were 65 years old and over. With increased life expectancy and lower birth rates, the proportion had grown to 13 percent by 2010.The 1900 census showed that Wyoming, Montana, and Nevada had 150 men for every 100 women. In 2010, the ratio was 96.7 men for every 100 women at the national level.Mississippi had the lowest per-capita income throughout the 80-year time period between 1930 and 2010.From 1910 to 1920, Los Angeles experienced growth from Hollywood’s dominance in the film industry. Its population increased by 81 percent that decade and its land area more than tripled.
E-bok
PDF, Engelska, 20161 919 kr
Läs direkt efter köp
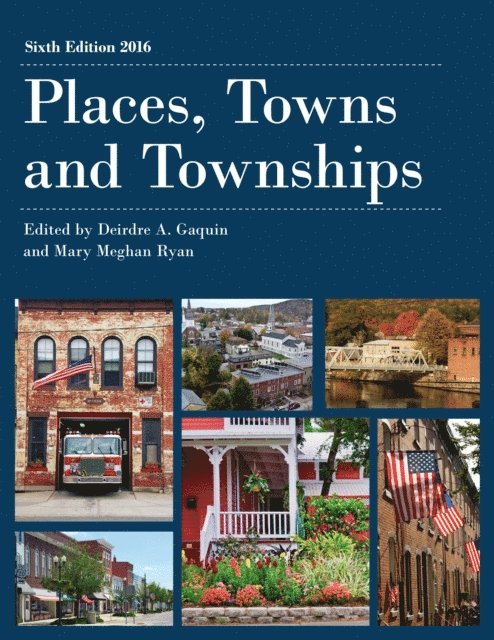
Places, Towns and Townships is an excellent resource for anyone in need of data for all of the nation''s cities, towns, townships, villages, and census-designated places in one convenient source. It compiles essential information about places in the United States and the people who live in them such as:• population• housing• income• education• employment• crime• and much more!In addition to the tables, Places, Towns and Townships includes text that describes key findings, figures that call attention to noteworthy trends in data, and rankings of the largest cities by various demographics. Compiled from multiple government sources, the data in this unique reference volume represents the most current and accurate information available. This data will not be updated for several years, making Places, Towns and Townships an invaluable resource in the years to come.Some interesting facts found in the 2016 edition of Places, Towns and Townships include:• While about 18 percent of the population lived in the nation’s 75 largest cities, 37 percent lived in places that were not incorporated as cities in 2014.• There were 34 incorporated cities and one town with more than 500,000 people in 2014. These 34 cities and towns represented only 23 states.• Among the 75 largest cities, Seattle, Boston, and San Francisco all have more than 72 percent of their residents in the 18-to-64 age group.• During the years 2010 through 2014, 13.1 percent of the residents of the United States were born in foreign countries. In 43 cities—mostly medium-sized cities and CDPs—more than half of the people are foreign-born. Many of these cities are in Florida.• In the five-year period from 2010 through 2014, 63.9 percent of Americans age 16 and older were in the civilian labor force, and 9.2 percent of the labor force participants were unemployed.• Nationally, Health Care and Social Assistance is the industrial sector with the most employees—16.6 percent of the total—followed by Retail Trade with 13.2 percent. Places, Towns and Townships makes a valuable addition to the County and City Extra Series.
E-bok
PDF, Engelska, 20171 570 kr
Läs direkt efter köp
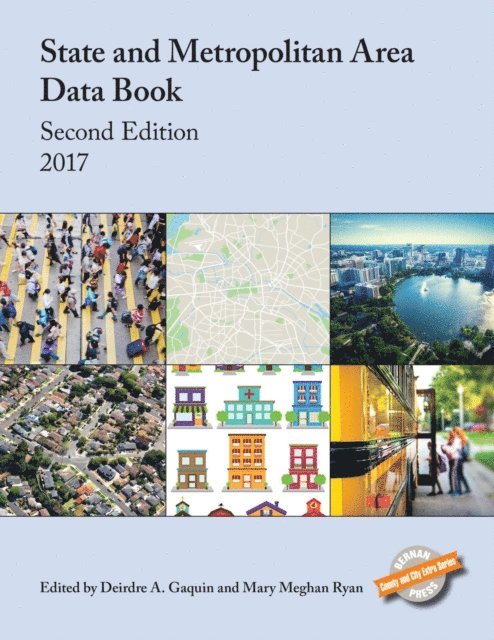
The State and Metropolitan Area Data Book is the continuation of the U.S. Census Bureau’s discontinued publication. It is a convenient summary of statistics on the social and economic structure of the states, metropolitan areas, and micropolitan areas in the United States. It is designed to serve as a statistical reference and guide to other data publications and sources. This new edition features more than 1,500 data items from a variety of sources. It covers many key topical areas including population, birth and death rates, health coverage, school enrollment, crime rates, income and housing, employment, transportation, and government.The metropolitan area information is based on the latest set of definitions of metropolitan and micropolitan areas including:a complete listing and data for all states, metropolitan areas, including micropolitan areas, and their component counties2010 census counts and more recent population estimates for all areasresults of the 2016 national and state electionsexpanded vital statistics, communication, and criminal justice datadata on migration and commuting habitsAmerican Community Survey 1- and 3-year estimatesdata on health insurance and housing and finance mattersaccurate and helpful citations to allow the user to directly consult the sourcesource notes and explanationsA guide to state statistical abstracts and state informationEconomic development officials, regional planners, urban researchers, college students, and data users can easily see the trends and changes affecting the nation today.

Inbunden, Engelska, 2017
1 895 kr
Skickas inom 10-15 vardagar
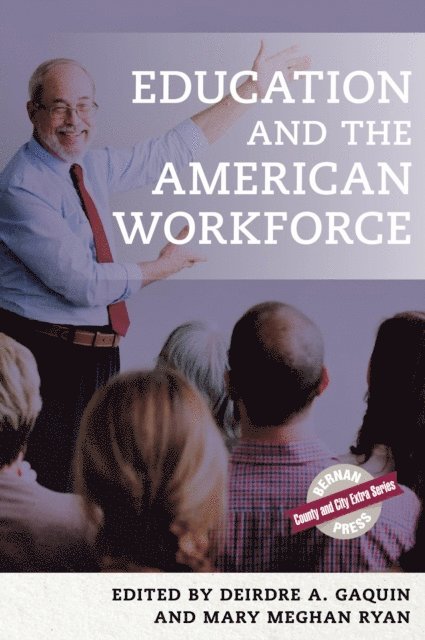
In a time of changing technology and cultural shifts, it is difficult to measure some aspects of the workforce. Education and the American Workforce brings together a comprehensive collection of employment and education information from federal statistical agencies. This publicationis a compilation of data about employment and education from federal statistical agencies. The Census Bureau is the leading source of quality data about the nation’s people and economy. The Bureau of Labor Statistics (BLS) is the principal federal agency responsible for measuring labor market activity, working conditions, and price changes in the economy. Together, these agencies produce a wealth of information about the American workforce. Education and the American Workforce includes information about the jobs that people hold—the occupations that they pursue and the industries where they work—and the education levels that people have attained. The geographic location of jobs is important. People often move to locations where jobs are plentiful, moving away from areas where jobs have decreased as technology and trends have changed. The education level of a local population can have an impact on the type of jobs available, with employers establishing businesses where they expect to find employees with appropriate educational credentials. This book uses the American Community Survey (ACS) to provide data on jobs and education in states, metropolitan areas, counties, cities, and congressional districts. The local area detail is necessarily less specific than the national data but the occupation categories use the same SOC categorization, grouped to protect the respondents’ privacy. These sections include ACS data about the labor force, educational attainment, and field of degree, often by age, gender, race, and Hispanic origin. Also included are some personal and household characteristics that are relevant to employment and education, such as health insurance and computer access.Some examples of interesting data found inside Education and the American Workforce include:With no formal educational requirement and a median salary of $22,680, 4.5 million people are employed as retail salespersons, the most of any single occupation. Cashiers and food preparation/serving workers account for another 3.5 million each. There are 2.9 million registered nurses, the most numerous of occupations that require a bachelor’s degree.The biggest numeric decline is expected for Postal Service mail carriers, dropping by about 78,000 in ten years. When combined with other Postal Service occupations—such as clerks, sorters, postmasters, and others—a decline of 140,000 jobs is expected for the Postal Service.Among the 75 largest counties, Bronx County, NY had the highest number of residents age 25 and over with less than a high school diploma at 29.4 percent while Montgomery County, PA had the lowest percentage at 6.2 percent.Meanwhile, New York County, NY and Fairfax County, VA had the highest percentage of residents with a bachelor’s degree or higher at 59.9 percent followed by Montgomery County, MD at 57.9 percent among the 75 largest counties. Nationally, between 2011 and 2015, 29.8 percent of the population had a bachelor’s degree or higher.
E-bok
PDF, Engelska, 20172 060 kr
Läs direkt efter köp
In a time of changing technology and cultural shifts, it is difficult to measure some aspects of the workforce. Education and the American Workforce brings together a comprehensive collection of employment and education information from federal statistical agencies. This publicationis a compilation of data about employment and education from federal statistical agencies. The Census Bureau is the leading source of quality data about the nation’s people and economy. The Bureau of Labor Statistics (BLS) is the principal federal agency responsible for measuring labor market activity, working conditions, and price changes in the economy. Together, these agencies produce a wealth of information about the American workforce. Education and the American Workforce includes information about the jobs that people hold—the occupations that they pursue and the industries where they work—and the education levels that people have attained. The geographic location of jobs is important. People often move to locations where jobs are plentiful, moving away from areas where jobs have decreased as technology and trends have changed. The education level of a local population can have an impact on the type of jobs available, with employers establishing businesses where they expect to find employees with appropriate educational credentials. This book uses the American Community Survey (ACS) to provide data on jobs and education in states, metropolitan areas, counties, cities, and congressional districts. The local area detail is necessarily less specific than the national data but the occupation categories use the same SOC categorization, grouped to protect the respondents’ privacy. These sections include ACS data about the labor force, educational attainment, and field of degree, often by age, gender, race, and Hispanic origin. Also included are some personal and household characteristics that are relevant to employment and education, such as health insurance and computer access.Some examples of interesting data found inside Education and the American Workforce include:With no formal educational requirement and a median salary of $22,680, 4.5 million people are employed as retail salespersons, the most of any single occupation. Cashiers and food preparation/serving workers account for another 3.5 million each. There are 2.9 million registered nurses, the most numerous of occupations that require a bachelor’s degree.The biggest numeric decline is expected for Postal Service mail carriers, dropping by about 78,000 in ten years. When combined with other Postal Service occupations—such as clerks, sorters, postmasters, and others—a decline of 140,000 jobs is expected for the Postal Service.Among the 75 largest counties, Bronx County, NY had the highest number of residents age 25 and over with less than a high school diploma at 29.4 percent while Montgomery County, PA had the lowest percentage at 6.2 percent.Meanwhile, New York County, NY and Fairfax County, VA had the highest percentage of residents with a bachelor’s degree or higher at 59.9 percent followed by Montgomery County, MD at 57.9 percent among the 75 largest counties. Nationally, between 2011 and 2015, 29.8 percent of the population had a bachelor’s degree or higher.
E-bok
PDF, Engelska, 20222 448 kr
Läs direkt efter köp
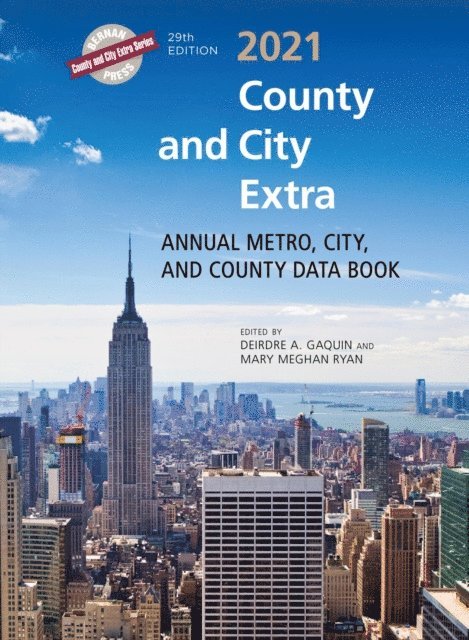
When you want only one source of information about your city or county, turn to County and City Extra.This trusted reference compiles information from many sources to provide all the key demographic and economic data for every state, county, metropolitan area, congressional district, and for all cities in the United States with a 2010 population of 25,000 or more. In one volume, you can conveniently find data from 1990 to 2020 in easy-to-read tables. The annual updating of County and City Extra for 29 years ensures its stature as a reliable and authoritative source for information. No other resource compiles this amount of detailed information into one place.Subjects covered in County and City Extra include:Population by age and raceGovernment financesIncome and povertyManufacturing, trade, and servicesCrimeHousingEducationImmigration and migrationLabor force and employmentAgriculture, land, and waterResidential constructionHealth resourcesVoting and electionsThe main body of this volume contains five basic parts and covers the following areas:Part A-StatesPart B-CountiesPart C-Metropolitan areasPart D-Cities with a 2010 census population of 25,000 or morePart E-Congressional districtsIn addition, this publication includes:Figures and text in each section that highlight pertinent data and provide analysisRanking tables which present each geography type by various subjects including population, land area, population density, educational attainment, housing values, race, unemployment, and crimeMultiple color maps of the United States on various topics including median household income, poverty, voting, and raceFurthermore, this volume contains several appendixes which include:Notes and explanations for further referenceDefinitions of geographic conceptsA listing of metropolitan and micropolitan areas and their component counties A list of cities by county Maps showing congressional districts, counties, and selected places within each state

E-bok
PDF, Engelska, 20232 266 kr
Läs direkt efter köp
When you want only one source of information about your city or county, turn to County and City Extra.This trusted reference compiles information from many sources to provide all the key demographic and economic data for every state, county, metropolitan area, congressional district, and for all cities in the United States with a 2010 population of 25,000 or more. In one volume, you can conveniently find data from 1990 to 2021 in easy-to-read tables. The annual updating of County and City Extra for 30 years ensures its stature as a reliable and authoritative source for information. No other resource compiles this amount of detailed information into one place.Subjects covered in County and City Extra include:Population by age and raceGovernment financesIncome and povertyManufacturing, trade, and servicesCrimeHousingEducationImmigration and migrationLabor force and employmentAgriculture, land, and waterResidential constructionHealth resourcesVoting and electionsThe main body of this volume contains five basic parts and covers the following areas:Part A-StatesPart B-CountiesPart C-Metropolitan areasPart D-Cities with a 2010 census population of 25,000 or morePart E-Congressional districtsIn addition, this publication includes:Figures and text in each section that highlight pertinent data and provide analysisRanking tables which present each geography type by various subjects including population, land area, population density, educational attainment, housing values, race, unemployment, and crimeMultiple color maps of the United States on various topics including median household income, poverty, voting, and raceFurthermore, this volume contains several appendixes which include:Notes and explanations for further referenceDefinitions of geographic conceptsA listing of metropolitan and micropolitan areas and their component counties A list of cities by county Maps showing congressional districts, counties, and selected places within each stateThis edition includes data from the first release of the 2020 Census—the Redistricting Data File—and population estimates derived by the Census Bureau using the new census numbers. Information on COVID-19 from the Centers for Disease Control is included for states and counties in Table B. This includes the number and rate of deaths from COVID-19 in 2020 for each county, as well as the number and rate of persons vaccinated through April 2022. Updated data include 2021 population estimates for states, counties, metropolitan areas, and cities. Also included are the latest available data for education, vital statistics, income and poverty, employment and unemployment, residential construction, production by industry, health resources, land use, city government finances, and many other topics.
Inbunden, Engelska, 2022
1 786 kr
Skickas inom 5-8 vardagar
Only updated every ten years, County and City Extra: Special Decennial Census Edition is an essential single-volume source for official census information. This edition contains easy-to-read geographic summaries of the United States population by race, Hispanic origin, and housing status. It provides the most up-to-date census data for each state, county, metropolitan area, congressional district, and all cities with a population of 25,000 or more. It complements the popular and trusted County and City Extra: Annual Metro, City, and County Data Book, also published by Bernan Press.Features of this publication include:Census data on all states, counties, metropolitan areas, and congressional districts, as well as on cities and towns with populations above 25,000Key data on over 5,000 geographic areasRanking tables which present each geography type by various subjects Data from previous censuses for comparative purposesColor maps that help the user understand the data
E-bok
PDF, Engelska, 20221 861 kr
Läs direkt efter köp
Only updated every ten years, County and City Extra: Special Decennial Census Edition is an essential single-volume source for official census information. This edition contains easy-to-read geographic summaries of the United States population by race, Hispanic origin, and housing status. It provides the most up-to-date census data for each state, county, metropolitan area, congressional district, and all cities with a population of 25,000 or more. It complements the popular and trusted County and City Extra: Annual Metro, City, and County Data Book, also published by Bernan Press.Features of this publication include:Census data on all states, counties, metropolitan areas, and congressional districts, as well as on cities and towns with populations above 25,000Key data on over 5,000 geographic areasRanking tables which present each geography type by various subjects Data from previous censuses for comparative purposesColor maps that help the user understand the data
E-bok
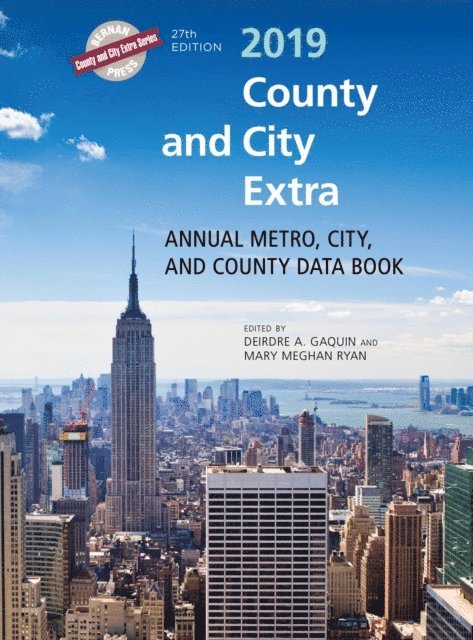
PDF, Engelska, 20192 215 kr
Läs direkt efter köp
When you want only one source of information about your city or county, turn to County and City Extra.This trusted reference compiles information from many sources to provide all the key demographic and economic data for every state, county, metropolitan area, congressional district, and for all cities in the United States with a 2010 population of 25,000 or more. In one volume , you can conveniently find data from 1990 to 2017 in easy-to-read tables. No other resource compiles this amount of detailed information into one place.Subjects covered in County and City Extra include:Population by age and raceGovernment financesIncome and povertyManufacturing, trade, and servicesCrimeHousingEducationImmigration and migrationLabor force and employmentAgriculture, land, and waterResidential constructionHealth resourcesVoting and electionsThe main body of this volume contains five basic parts and covers the following areas:Part A-StatesPart B-CountiesPart C-Metropolitan areasPart D-Cities with a 2010 census population of 25,000 or morePart E-Congressional districtsIn addition, this publication includes:Figures and text in each section that highlight pertinent data and provide analysisRanking tables which present each geography type by various subjects including population, land area, population density, educational attainment, housing values, race, unemployment, and crimeMultiple color maps of the United States on various topics including median household income, poverty, voting, and raceFurthermore, this volume contains several appendixes which include:Notes and explanations for further referenceDefinitions of geographic conceptsA listing of metropolitan and micropolitan areas and their component counties A list of cities by county Maps showing congressional districts, counties, and selected places within each state
E-bok
PDF, Engelska, 20181 580 kr
Läs direkt efter köp
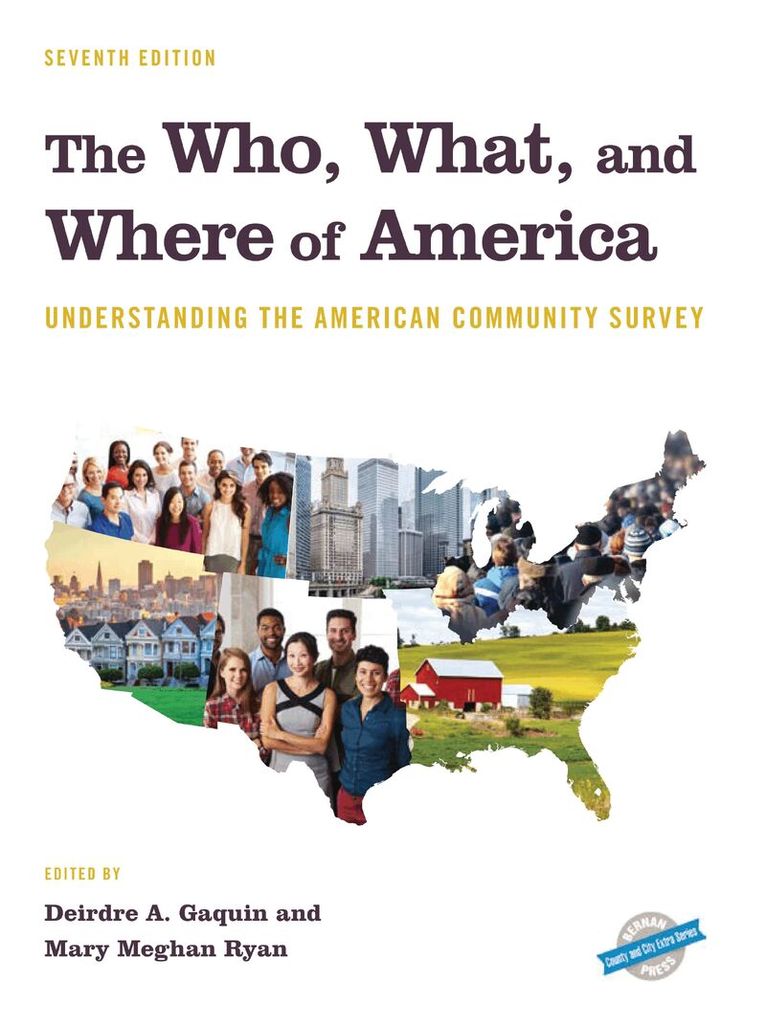
The Who, What, and Where of America is designed to provide a sampling of key demographic information. It covers the United States, every state, each metropolitan statistical area, and all the counties and cities with a population of 20,000 or more. Who: Age, Race and Ethnicity, and Household StructureWhat: Education, Employment, and IncomeWhere: Migration, Housing, and TransportationEach part is preceded by highlights and ranking tables that show how areas diverge from the national norm. These research aids are invaluable for understanding data from the ACS and for highlighting what it tells us about who we are, what we do, and where we live.Each topic is divided into four tables revealing the results of the data collected from different types of geographic areas in the United States, generally with populations greater than 20,000. Table A. StatesTable B. CountiesTable C. Metropolitan AreasTable D. CitiesIn this edition, you will find social and economic estimates on the ways American communities are changing with regard to the following:Age and raceHealth care coverageMarital historyEducation attainmentIncome and occupationCommute time to workEmployment statusHome values and monthly costsVeteran statusSize of home or rental unitThis title is the latest in the County and City Extra Series of publications from Bernan Press. Other titles include County and City Extra, County and City Extra: Special Decennial Census Edition, and Places, Towns, and Townships.
E-bok
PDF, Engelska, 20202 287 kr
Läs direkt efter köp
When you want only one source of information about your city or county, turn to County and City Extra.This trusted reference compiles information from many sources to provide all the key demographic and economic data for every state, county, metropolitan area, congressional district, and for all cities in the United States with a 2010 population of 25,000 or more. In one volume, you can conveniently find data from 1990 to 2018 in easy-to-read tables. The annual updating of County and City Extra for 27 years ensures its stature as a reliable and authoritative source for information. No other resource compiles this amount of detailed information into one place.This edition contains information from the just released 2017 Census of Agriculture. Subjects covered in County and City Extra include:Population by age and raceGovernment financesIncome and povertyManufacturing, trade, and servicesCrimeHousingEducationImmigration and migrationLabor force and employmentAgriculture, land, and waterResidential constructionHealth resourcesVoting and electionsThe main body of this volume contains five basic parts and covers the following areas:Part A-StatesPart B-CountiesPart C-Metropolitan areasPart D-Cities with a 2010 census population of 25,000 or morePart E-Congressional districtsIn addition, this publication includes:Figures and text in each section that highlight pertinent data and provide analysisRanking tables which present each geography type by various subjects including population, land area, population density, educational attainment, housing values, race, unemployment, and crimeMultiple color maps of the United States on various topics including median household income, poverty, voting, and raceFurthermore, this volume contains several appendixes which include:Notes and explanations for further referenceDefinitions of geographic conceptsA listing of metropolitan and micropolitan areas and their component counties A list of cities by county Maps showing congressional districts, counties, and selected places within each state
Inbunden, Engelska, 2019
1 673 kr
Skickas inom 10-15 vardagar
The Who, What, and Where of America is designed to provide a sampling of key demographic information. It covers the United States, every state, each metropolitan statistical area, and all the counties and cities with a population of 20,000 or more. Who: Age, Race and Ethnicity, and Household StructureWhat: Education, Employment, and IncomeWhere: Migration, Housing, and TransportationEach part is preceded by highlights and ranking tables that show how areas diverge from the national norm. These research aids are invaluable for understanding data from the ACS and for highlighting what it tells us about who we are, what we do, and where we live.Each topic is divided into four tables revealing the results of the data collected from different types of geographic areas in the United States, generally with populations greater than 20,000. Table A. StatesTable B. CountiesTable C. Metropolitan AreasTable D. CitiesIn this edition, you will find social and economic estimates on the ways American communities are changing with regard to the following:Age and raceHealth care coverageMarital historyEducation attainmentIncome and occupationCommute time to workEmployment statusHome values and monthly costsVeteran statusSize of home or rental unitThis title is the latest in the County and City Extra Series of publications from Bernan Press. Other titles include County and City Extra, County and City Extra: Special Decennial Census Edition, and Places, Towns, and Townships.

E-bok
PDF, Engelska, 20191 738 kr
Läs direkt efter köp
The Who, What, and Where of America is designed to provide a sampling of key demographic information. It covers the United States, every state, each metropolitan statistical area, and all the counties and cities with a population of 20,000 or more. Who: Age, Race and Ethnicity, and Household StructureWhat: Education, Employment, and IncomeWhere: Migration, Housing, and TransportationEach part is preceded by highlights and ranking tables that show how areas diverge from the national norm. These research aids are invaluable for understanding data from the ACS and for highlighting what it tells us about who we are, what we do, and where we live.Each topic is divided into four tables revealing the results of the data collected from different types of geographic areas in the United States, generally with populations greater than 20,000. Table A. StatesTable B. CountiesTable C. Metropolitan AreasTable D. CitiesIn this edition, you will find social and economic estimates on the ways American communities are changing with regard to the following:Age and raceHealth care coverageMarital historyEducation attainmentIncome and occupationCommute time to workEmployment statusHome values and monthly costsVeteran statusSize of home or rental unitThis title is the latest in the County and City Extra Series of publications from Bernan Press. Other titles include County and City Extra, County and City Extra: Special Decennial Census Edition, and Places, Towns, and Townships.
Häftad, Engelska, 2020
1 673 kr
Skickas inom 10-15 vardagar
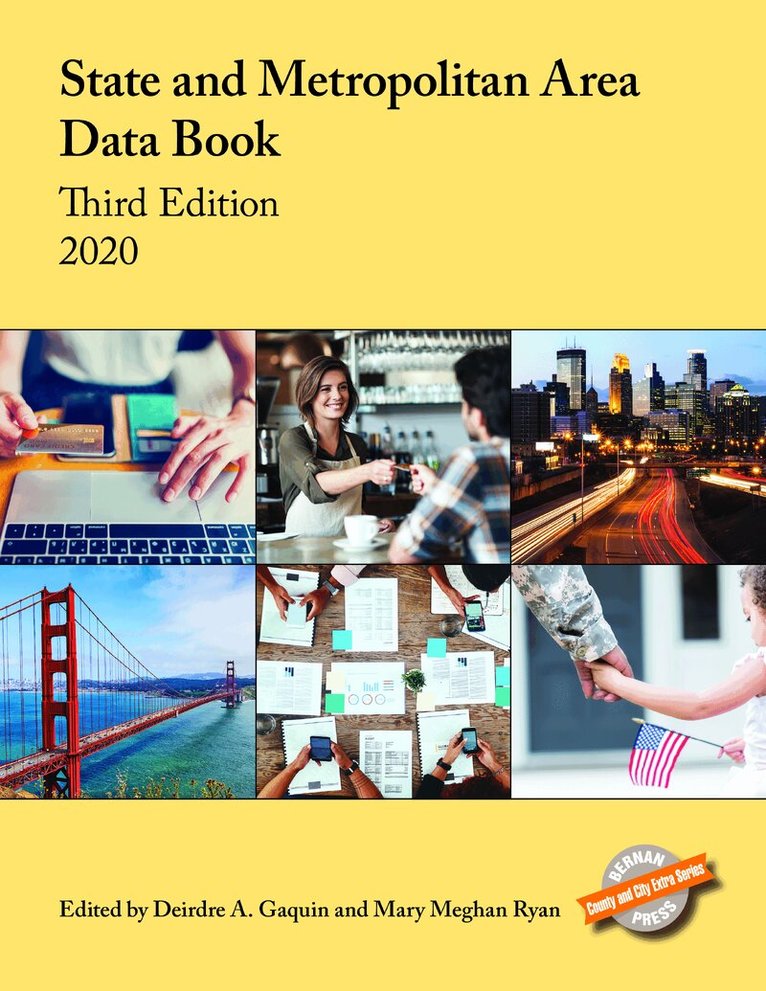
The State and Metropolitan Area Data Book is the continuation of the U.S. Census Bureau’s discontinued publication. It is a convenient summary of statistics on the social and economic structure of the states, metropolitan areas, and micropolitan areas in the United States. It is designed to serve as a statistical reference and guide to other data publications and sources. This new edition features more than 1,500 data items from a variety of sources. It covers many key topical areas including population, birth and death rates, health coverage, school enrollment, crime rates, income and housing, employment, transportation, and government.The metropolitan area information is based on the latest set of definitions of metropolitan and micropolitan areas including:a complete listing and data for all states, metropolitan areas, including micropolitan areas, and their component counties2010 census counts and more recent population estimates for all areasresults of the 2016 national and state electionsexpanded vital statistics, communication, and criminal justice datadata on migration and commuting habitsAmerican Community Survey 1- and 3-year estimatesdata on health insurance and housing and finance mattersaccurate and helpful citations to allow the user to directly consult the sourcesource notes and explanationsA guide to state statistical abstracts and state informationEconomic development officials, regional planners, urban researchers, college students, and data users can easily see the trends and changes affecting the nation today.
E-bok
PDF, Engelska, 20201 635 kr
Läs direkt efter köp
The State and Metropolitan Area Data Book is the continuation of the U.S. Census Bureau’s discontinued publication. It is a convenient summary of statistics on the social and economic structure of the states, metropolitan areas, and micropolitan areas in the United States. It is designed to serve as a statistical reference and guide to other data publications and sources. This new edition features more than 1,500 data items from a variety of sources. It covers many key topical areas including population, birth and death rates, health coverage, school enrollment, crime rates, income and housing, employment, transportation, and government.The metropolitan area information is based on the latest set of definitions of metropolitan and micropolitan areas including:a complete listing and data for all states, metropolitan areas, including micropolitan areas, and their component counties2010 census counts and more recent population estimates for all areasresults of the 2016 national and state electionsexpanded vital statistics, communication, and criminal justice datadata on migration and commuting habitsAmerican Community Survey 1- and 3-year estimatesdata on health insurance and housing and finance mattersaccurate and helpful citations to allow the user to directly consult the sourcesource notes and explanationsA guide to state statistical abstracts and state informationEconomic development officials, regional planners, urban researchers, college students, and data users can easily see the trends and changes affecting the nation today.
E-bok
PDF, Engelska, 20212 577 kr
Läs direkt efter köp
When you want only one source of information about your city or county, turn to County and City Extra.This trusted reference compiles information from many sources to provide all the key demographic and economic data for every state, county, metropolitan area, congressional district, and for all cities in the United States with a 2010 population of 25,000 or more. In one volume , you can conveniently find data from 1990 to 2019 in easy-to-read tables. The annual updating of County and City Extra for 28 years ensures its stature as a reliable and authoritative source for information. No other resource compiles this amount of detailed information into one place.Subjects covered in County and City Extra include:Population by age and raceGovernment financesIncome and povertyManufacturing, trade, and servicesCrimeHousingEducationImmigration and migrationLabor force and employmentAgriculture, land, and waterResidential constructionHealth resourcesVoting and electionsThe main body of this volume contains five basic parts and covers the following areas:Part A-StatesPart B-CountiesPart C-Metropolitan areasPart D-Cities with a 2010 census population of 25,000 or morePart E-Congressional districtsIn addition, this publication includes:Figures and text in each section that highlight pertinent data and provide analysisRanking tables which present each geography type by various subjects including population, land area, population density, educational attainment, housing values, race, unemployment, and crimeMultiple color maps of the United States on various topics including median household income, poverty, voting, and raceFurthermore, this volume contains several appendixes which include:Notes and explanations for further referenceDefinitions of geographic conceptsA listing of metropolitan and micropolitan areas and their component counties A list of cities by county Maps showing congressional districts, counties, and selected places within each state
Inbunden, Engelska, 2021
1 673 kr
Skickas inom 10-15 vardagar
Places, Towns and Townships is an excellent resource for anyone in need of data for all of the nation's cities, towns, townships, villages, and census-designated places in one convenient source. It compiles essential information about places in the United States and the people who live in them such as:• population• housing• income• education• employment• crime• and much more!In addition to the tables, Places, Towns and Townships includes text that describes key findings, figures that call attention to noteworthy trends in data, and rankings of the largest cities by various demographics. Compiled from multiple government sources, the data in this unique reference volume represents the most current and accurate information available. This data will not be updated for several years, making Places, Towns and Townships an invaluable resource in the years to come.
E-bok
PDF, Engelska, 20211 801 kr
Läs direkt efter köp
Places, Towns and Townships is an excellent resource for anyone in need of data for all of the nation''s cities, towns, townships, villages, and census-designated places in one convenient source. It compiles essential information about places in the United States and the people who live in them such as:• population• housing• income• education• employment• crime• and much more!In addition to the tables, Places, Towns and Townships includes text that describes key findings, figures that call attention to noteworthy trends in data, and rankings of the largest cities by various demographics. Compiled from multiple government sources, the data in this unique reference volume represents the most current and accurate information available. This data will not be updated for several years, making Places, Towns and Townships an invaluable resource in the years to come.