Marco Riani – författare
Visar alla böcker från författaren Marco Riani. Handla med fri frakt och snabb leverans.
9 produkter
9 produkter
E-bok
PDF, Engelska, 20131 367 kr
Läs direkt efter köp
Why We Wrote This Book This book is about using graphs to explore and model continuous multi variate data. Such data are often modelled using the multivariate normal distribution and, indeed, there is a literatme of weighty statistical tomes presenting the mathematical theory of this activity. Our book is very dif ferent. Although we use the methods described in these books, we focus on ways of exploring whether the data do indeed have a normal distribution. We emphasize outlier detection, transformations to normality and the de tection of clusters and unsuspected influential subsets. We then quantify the effect of these departures from normality on procedures such as dis crimination and duster analysis. The normal distribution is central to our book because, subject to our exploration of departures, it provides useful models for many sets of data. However, the standard estimates of the parameters, especially the covari ance matrix of the observations, are highly sensitive to the presence of outliers. This is both a blessing and a curse. It is a blessing because, if we estimate the parameters with the outliers excluded, their effect is appre ciable and apparent if we then include them for estimation. It is however a curse because it can be hard to detect which observations are outliers. We use the forward search for this purpose.
Inbunden, Engelska, 2004
1 086 kr
Skickas inom 10-15 vardagar
Why We Wrote This Book This book is about using graphs to explore and model continuous multi variate data. Such data are often modelled using the multivariate normal distribution and, indeed, there is a literatme of weighty statistical tomes presenting the mathematical theory of this activity. Our book is very dif ferent. Although we use the methods described in these books, we focus on ways of exploring whether the data do indeed have a normal distribution. We emphasize outlier detection, transformations to normality and the de tection of clusters and unsuspected influential subsets. We then quantify the effect of these departures from normality on procedures such as dis crimination and duster analysis. The normal distribution is central to our book because, subject to our exploration of departures, it provides useful models for many sets of data. However, the standard estimates of the parameters, especially the covari ance matrix of the observations, are highly sensitive to the presence of outliers. This is both a blessing and a curse. It is a blessing because, if we estimate the parameters with the outliers excluded, their effect is appre ciable and apparent if we then include them for estimation. It is however a curse because it can be hard to detect which observations are outliers. We use the forward search for this purpose.
Inbunden, Engelska, 2000
1 086 kr
Skickas inom 10-15 vardagar
This book is about using graphs to understand the relationship between a regression model and the data to which it is fitted. Because of the way in which models are fitted, for example, by least squares, we can lose infor mation about the effect of individual observations on inferences about the form and parameters of the model. The methods developed in this book reveal how the fitted regression model depends on individual observations and on groups of observations. Robust procedures can sometimes reveal this structure, but downweight or discard some observations. The novelty in our book is to combine robustness and a forward" " search through the data with regression diagnostics and computer graphics. We provide easily understood plots that use information from the whole sample to display the effect of each observation on a wide variety of aspects of the fitted model. This bald statement of the contents of our book masks the excitement we feel about the methods we have developed based on the forward search. We are continuously amazed, each time we analyze a new set of data, by the amount of information the plots generate and the insights they provide. We believe our book uses comparatively elementary methods to move regression in a completely new and useful direction. We have written the book to be accessible to students and users of statistical methods, as well as for professional statisticians.
Häftad, Engelska, 2010
1 626 kr
Skickas inom 10-15 vardagar
Why We Wrote This Book This book is about using graphs to explore and model continuous multi variate data. Such data are often modelled using the multivariate normal distribution and, indeed, there is a literatme of weighty statistical tomes presenting the mathematical theory of this activity. Our book is very dif ferent. Although we use the methods described in these books, we focus on ways of exploring whether the data do indeed have a normal distribution. We emphasize outlier detection, transformations to normality and the de tection of clusters and unsuspected influential subsets. We then quantify the effect of these departures from normality on procedures such as dis crimination and duster analysis. The normal distribution is central to our book because, subject to our exploration of departures, it provides useful models for many sets of data. However, the standard estimates of the parameters, especially the covari ance matrix of the observations, are highly sensitive to the presence of outliers. This is both a blessing and a curse. It is a blessing because, if we estimate the parameters with the outliers excluded, their effect is appre ciable and apparent if we then include them for estimation. It is however a curse because it can be hard to detect which observations are outliers. We use the forward search for this purpose.
E-bok
PDF, Engelska, 20121 416 kr
Läs direkt efter köp
This book is about using graphs to understand the relationship between a regression model and the data to which it is fitted. Because of the way in which models are fitted, for example, by least squares, we can lose infor mation about the effect of individual observations on inferences about the form and parameters of the model. The methods developed in this book reveal how the fitted regression model depends on individual observations and on groups of observations. Robust procedures can sometimes reveal this structure, but downweight or discard some observations. The novelty in our book is to combine robustness and a forward" " search through the data with regression diagnostics and computer graphics. We provide easily understood plots that use information from the whole sample to display the effect of each observation on a wide variety of aspects of the fitted model. This bald statement of the contents of our book masks the excitement we feel about the methods we have developed based on the forward search. We are continuously amazed, each time we analyze a new set of data, by the amount of information the plots generate and the insights they provide. We believe our book uses comparatively elementary methods to move regression in a completely new and useful direction. We have written the book to be accessible to students and users of statistical methods, as well as for professional statisticians.
Häftad, Engelska, 2012
1 086 kr
Skickas inom 10-15 vardagar
This book is about using graphs to understand the relationship between a regression model and the data to which it is fitted. Because of the way in which models are fitted, for example, by least squares, we can lose infor mation about the effect of individual observations on inferences about the form and parameters of the model. The methods developed in this book reveal how the fitted regression model depends on individual observations and on groups of observations. Robust procedures can sometimes reveal this structure, but downweight or discard some observations. The novelty in our book is to combine robustness and a forward" " search through the data with regression diagnostics and computer graphics. We provide easily understood plots that use information from the whole sample to display the effect of each observation on a wide variety of aspects of the fitted model. This bald statement of the contents of our book masks the excitement we feel about the methods we have developed based on the forward search. We are continuously amazed, each time we analyze a new set of data, by the amount of information the plots generate and the insights they provide. We believe our book uses comparatively elementary methods to move regression in a completely new and useful direction. We have written the book to be accessible to students and users of statistical methods, as well as for professional statisticians.
Inbunden, Engelska, 2025
549 kr
Skickas inom 10-15 vardagar
This open access book presents robust statistical methods and procedures through the monitoring approach, with an emphasis on applications to linear regression. Illustrating the theory, it explores both large and small-sample properties. The performance of the forward search and of the monitoring of static robust estimators for regression data are illuminated through numerous data analyses using MATLAB and R.The book describes the results of many years’ work of the authors in the development of powerful methods of robust regression analysis. Robust methods are designed to analyse contaminated data. The well-established static robust methods estimate model features, such as parameter estimates, assuming the amount of contamination in the data is known. These methods are described in detail in Chapter 2 for estimation in a simple sample. The extension to regression is presented in Chapter 3, with an emphasis on S-estimation and related procedures as well as on least trimmed squares. The monitoring methods of Chapter 4, including the forward search, find the appropriate level of robustness for each data set and so avoid biased estimation from the inclusion of outliers and inefficiency due to the deletion of uncontaminated observations. This analysis is followed by examples which illustrate the use of the interactive graphical analyses associated with the authors’ FSDA toolbox. Numerical comparisons of the size and power of outlier tests appear in Chapter 5. Later chapters illustrate applications to response transformation in regression and to non-parametric regression. Extensions of the robust multiple regression model include Bayesian, heteroskedastic, time series and compositional regression, together with the clustering of regression models. Finally, several approaches to model selection are investigated and robust analyses of regression data are presented that illustrate the use of the techniques introduced earlier. Exercises are given at the end of each chapter, with solutions at the end of the book. The MATLAB code can be reproduced using MATLAB Online, without the need for a license, or via the language-agnostic Jupyter notebook environment, after installing the MATLAB kernel. Online computer code is available for all examples and exercises, together with a series of YouTube videos.Aimed at professional statisticians and researchers concerned with insightful data analysis, as well as postgraduate students, the book may also serve as a text for a modern interactive robust regression course.
1 612 kr
Skickas inom 10-15 vardagar
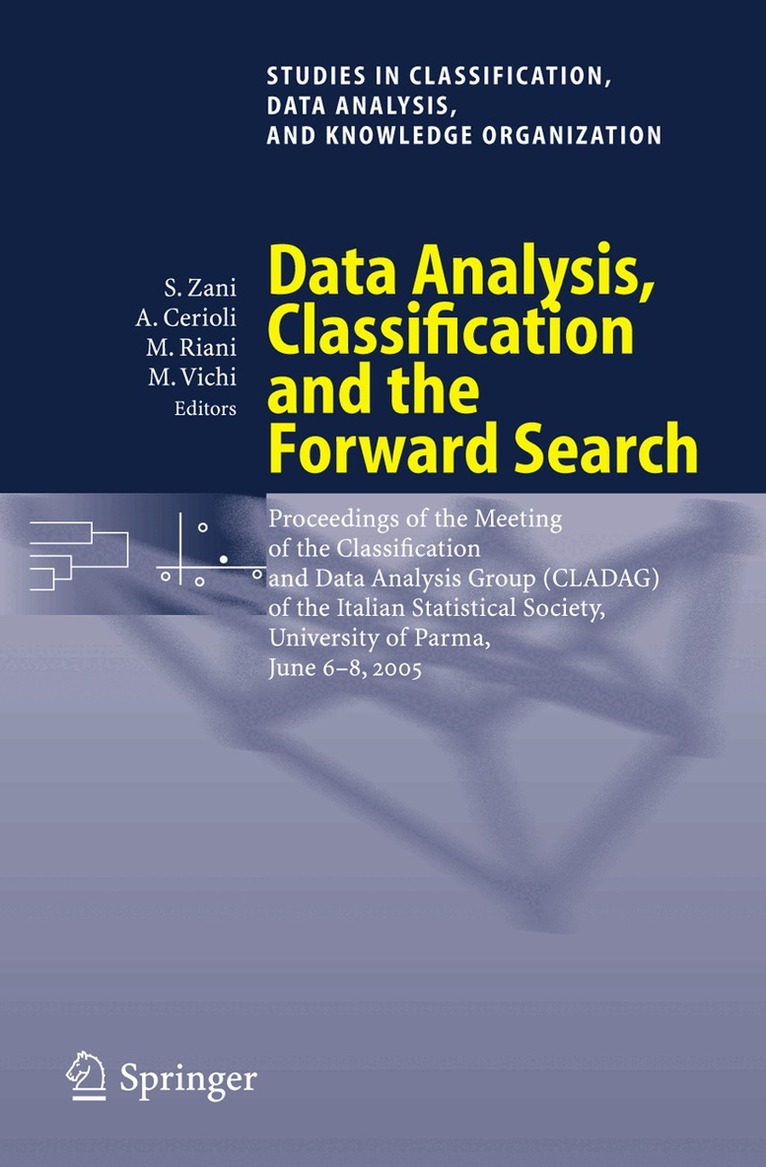
This volume contains revised versions of selected papers presented at the biennial meeting of the Classification and Data Analysis Group (CLADAG) of the Italian Statistical Society, which was held in Parma, June 6-8, 2005. Sergio Zani chaired the Scientific Programme Committee and Andrea Cerioli chaired the Local Organizing Committee. The scientific programme of the conference included 127 papers, 42 in spe cialized sessions, 68 in contributed paper sessions and 17 in poster sessions. Moreover, it was possible to recruit five notable and internationally renowned invited speakers (including the 2004-2005 President of the International Fed eration of Classification Societies) for plenary talks on their current research work. Among the specialized sessions, two were organized by Wolfgang Gaul with five talks by members of the GfKl (German Classification Society), and one by Jacqueline J. Meulman (Dutch/Flemish Classification Society). Thus, the conference provided a large number of scientists and experts from home and abroad with an attractive forum for discussion and mutual exchange of knowledge. The topics of all plenary and specialized sessions were chosen to fit, in the broadest possible sense, the mission of CLADAG, the aim of which is "to further methodological, computational and applied research within the fields of Classification, Data Analysis and Multivariate Statistics". A peer-review refereeing process led to the selection of 46 extended papers, which are contained in this book.
E-bok
PDF, Engelska, 20071 977 kr
Läs direkt efter köp
This volume contains revised versions of selected papers presented at the biennial meeting of the Classification and Data Analysis Group (CLADAG) of the Italian Statistical Society, which was held in Parma, June 6-8, 2005. Sergio Zani chaired the Scientific Programme Committee and Andrea Cerioli chaired the Local Organizing Committee. The scientific programme of the conference included 127 papers, 42 in spe cialized sessions, 68 in contributed paper sessions and 17 in poster sessions. Moreover, it was possible to recruit five notable and internationally renowned invited speakers (including the 2004-2005 President of the International Fed eration of Classification Societies) for plenary talks on their current research work. Among the specialized sessions, two were organized by Wolfgang Gaul with five talks by members of the GfKl (German Classification Society), and one by Jacqueline J. Meulman (Dutch/Flemish Classification Society). Thus, the conference provided a large number of scientists and experts from home and abroad with an attractive forum for discussion and mutual exchange of knowledge. The topics of all plenary and specialized sessions were chosen to fit, in the broadest possible sense, the mission of CLADAG, the aim of which is "to further methodological, computational and applied research within the fields of Classification, Data Analysis and Multivariate Statistics". A peer-review refereeing process led to the selection of 46 extended papers, which are contained in this book.