Fler böcker inom
- Format
- WebSite Associated w/Book
- Språk
- Engelska
- Antal sidor
- 320
- Utgivningsdatum
- 2013-04-12
- Förlag
- John Wiley & Sons Inc
- Dimensioner
- 233 x 189 x 17 mm
- Vikt
- ISBN
- 9781118462195
- 731 g
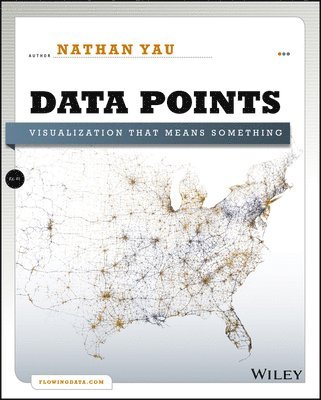
Data Points
Visualization That Means Something
WebSite Associated w/Book,
Engelska, 2013-04-12
308
- Skickas från oss inom 5-8 vardagar.
- Fri frakt över 249 kr för privatkunder i Sverige.
Finns även som
Passar bra ihop
De som köpt den här boken har ofta också köpt Careless People av Sarah Wynn-Williams (häftad).
Köp båda 2 för 514 krKundrecensioner
Fler böcker av Nathan Yau
-
Visualize This
Nathan Yau
-
Visualize This!
Nathan Yau
-
FlowingData.com Data Visualization Set
Nathan Yau
Övrig information
Nathan Yau has a PhD in statistics and is a statistical consultant who helps clients make use of their data through visualization. He created the popular site FlowingData.com, and is the author of Visualize This: The FlowingData Guide to Design, Visualization, and Statistics, also published by Wiley.
Du kanske gillar
-
Nexus
Yuval Noah Harari
Häftad -
The Creative Act
Rick Rubin
Inbunden


