• Fri frakt över 249 kr
  • •
  • Snabba leveranser
  • •
  • Billiga böcker
Kundservice

Du är på sajten för privatpersoner.

Företag, bibliotek eller offentlig verksamhet?

Du handlar på classic.bokus.com, där alla dina funktioner finns intakta.
Till classic.bokus.com
Bokus logotyp. Gå till startsidan.
  • Erbjudanden
  • Nyheter
  • Student
  • Topplistor
  • Barn & ungdom
  • Bokus Play
  • E-böcker
  • Pocketböcker
  • Spel & pussel

10% rabatt på allt med kod: NYSTART10 →

Sidfot

Mina sidor

    Hjälp

    • Kundservice
    • Vanliga frågor och svar
    • Frakt och leverans
    • Retur vid ångerrätt
    • Reklamera vara
    • Betalning
    • Köpvillkor
    • Allmänna villkor
    • Information om webbplatsens tillgänglighet

    Om Bokus

    • Om oss
    • Pressrum
    • För studenter
    • För företag
    • För bibliotek och offentlig verksamhet
    • För leverantörer
    • Hållbarhet

    Populärt

    • Aktuella erbjudanden
    • Presentkort
    • Studentlitteratur
    • Nya böcker
    • Topplistor
    • Signerade böcker
    • Engelska böcker

    Inspiration

    • Boktips
    • BookTok
    • Populära bokserier
    • Barnbokskaraktärer
    • Populära författare
    Logotyp för Bokus
    Följ oss på Facebook (extern länk)Följ oss på Instagram (extern länk)Följ oss på YouTube (extern länk)Följ oss på TikTok (extern länk)
    bokus @ CookiesAnpassa cookiesIntegritetspolicyKöpvillkor
    Till Citymail hemsida (extern länk)Till Budbee hemsida (extern länk)Till Postnord hemsida (extern länk)Till Schenker hemsida (extern länk)Till Early Bird hemsida (extern länk)Till Walleys hemsida (extern länk)
    1. Kultur
    2. Scenkonst och film
    3. Internet och digitala medier

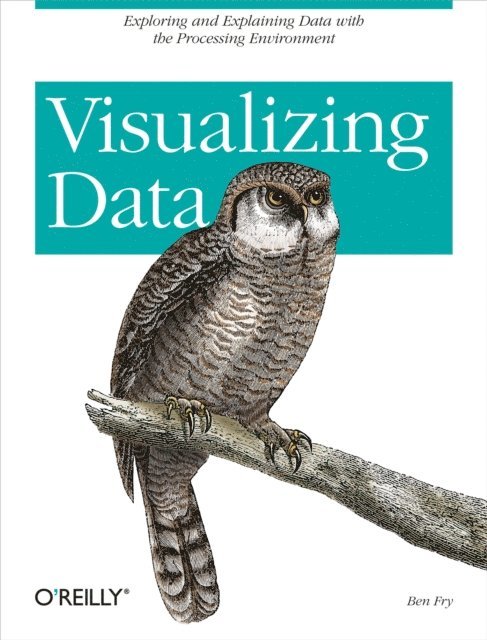
    Visualizing Data

    Exploring and Explaining Data with the Processing Environment

    AvBen Fry

    E-bok
    PDF, Engelska, 2007

    389 kr

    Läs direkt i Bokus Reader – eller ladda ned till din enhet (PDF kräver ofta zoom och scroll på små skärmar).

    Fler format och utgåvor

    Häftad

    300 kr

    E-bok

    328 kr

    Beskrivning

    Enormous quantities of data go unused or underused today, simply because people can''t visualize the quantities and relationships in it. Using a downloadable programming environment developed by the author, Visualizing Data demonstrates methods for representing data accurately on the Web and elsewhere, complete with user interaction, animation, and more.

    How do the 3.1 billion A, C, G and T letters of the human genome compare to those of a chimp or a mouse? What do the paths that millions of visitors take through a web site look like? With Visualizing Data, you learn how to answer complex questions like these with thoroughly interactive displays. We''re not talking about cookie-cutter charts and graphs. This book teaches you how to design entire interfaces around large, complex data sets with the help of a powerful new design and prototyping tool called "Processing".

    Used by many researchers and companies to convey specific data in a clear and understandable manner, the Processing beta is available free. With this tool and Visualizing Data as a guide, you''ll learn basic visualization principles, how to choose the right kind of display for your purposes, and how to provide interactive features that will bring users to your site over and over. This book teaches you:

    • The seven stages of visualizing data -- acquire, parse, filter, mine, represent, refine, and interact
    • How all data problems begin with a question and end with a narrative construct that provides a clear answer without extraneous details
    • Several example projects with the code to make them work
    • Positive and negative points of each representation discussed. The focus is on customization so that each one best suits what you want to convey about your data set
    The book does not provide ready-made "visualizations" that can be plugged into any data set. Instead, with chapters divided by types of data rather than types of display, you''ll learn how each visualization conveys the unique properties of the data it represents -- why the data was collected, what''s interesting about it, and what stories it can tell. Visualizing Data teaches you how to answer questions, not simply display information.

    Produktinformation

    • Utgivningsdatum:2007-12-18
    • Språk:Engelska
    • Filformat:PDF
    • Kopieringsskydd:LCP
    • ISBN:9780596519308
    • Förlag:O'Reilly Media

    Utforska kategorier

    • Internet och digitala medier inom Kultur
    • Digital livsstil och datorspel inom Data och IT
    • Programmeringsböcker inom Data och IT