• Fri frakt över 249 kr
  • •
  • Snabba leveranser
  • •
  • Billiga böcker
Kundservice

Du är på sajten för privatpersoner.

Företag, bibliotek eller offentlig verksamhet?

Du handlar på classic.bokus.com, där alla dina funktioner finns intakta.
Till classic.bokus.com
Bokus logotyp. Gå till startsidan.
  • Erbjudanden
  • Student
  • Topplistor
  • Barn & ungdom
  • Bokus Play
  • E-böcker
  • Ljudböcker
  • Pocketböcker
  • Spel & pussel

10% rabatt på allt med kod NYSTART10 →

Sidfot

Mina sidor

    Hjälp

    • Kundservice
    • Vanliga frågor och svar
    • Frakt och leverans
    • Retur vid ångerrätt
    • Reklamera vara
    • Betalning
    • Köpvillkor
    • Allmänna villkor
    • Information om webbplatsens tillgänglighet

    Om Bokus

    • Om oss
    • Pressrum
    • För studenter
    • För företag
    • För bibliotek och offentlig verksamhet
    • För leverantörer
    • Hållbarhet

    Populärt

    • Aktuella erbjudanden
    • Presentkort
    • Studentlitteratur
    • Nya böcker
    • Topplistor
    • Signerade böcker
    • Engelska böcker

    Inspiration

    • Boktips
    • BookTok
    • Populära bokserier
    • Barnbokskaraktärer
    • Populära författare
    Logotyp för Bokus
    Följ oss på Facebook (extern länk)Följ oss på Instagram (extern länk)Följ oss på YouTube (extern länk)Följ oss på TikTok (extern länk)
    bokus @ CookiesAnpassa cookiesIntegritetspolicyKöpvillkor
    Till Citymail hemsida (extern länk)Till Budbee hemsida (extern länk)Till Postnord hemsida (extern länk)Till Schenker hemsida (extern länk)Till Early Bird hemsida (extern länk)Till Walleys hemsida (extern länk)
    1. Ekonomi och Ledarskap
    2. Företagsekonomi
    3. Redovisning och finansiering
    4. Finansiering

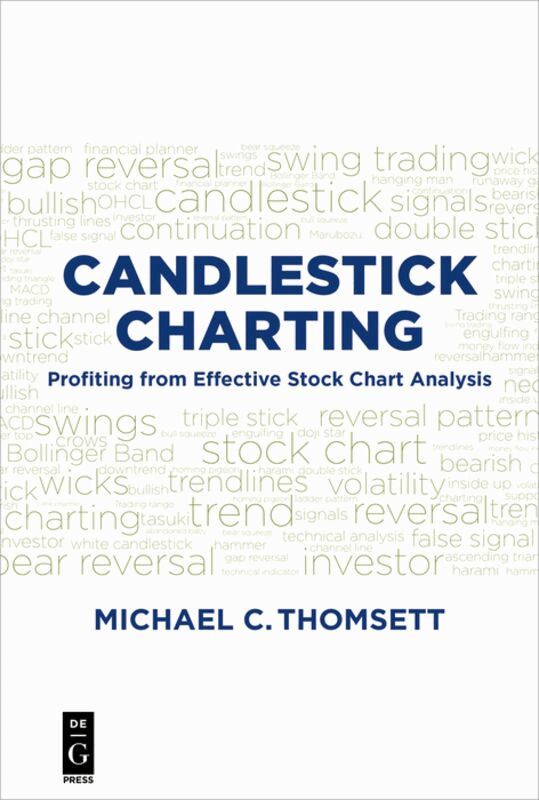
    Candlestick Charting

    Profiting from Effective Stock Chart Analysis

    AvMichael C. Thomsett

    Häftad, Engelska, 2017

    691 kr

    Beställningsvara. Skickas inom 5-8 vardagar. Fri frakt över 249 kr.

    Fler format och utgåvor

    E-bok

    797 kr

    E-bok

    797 kr

    Beskrivning

    Investors and traders seek methods to identify reversal and continuation to better time their trades. This applies for virtually everyone, whether employing a swing trading strategy, engaging in options trading, or timing entry and exit to spot bull and bear reversals. Key signals are found in the dozens of candlesticks, combined with technical signals such as gaps and moves outside of the trading range; size of wicks (shadows) and size of real bodies. The science of candlestick analysis has a proven track record not only from its inception in 17th century Japan, but today as well. This book explains and demonstrates candlestick signals, including both the appearance of each but in context on an actual stock chart. It further takes the reader through the rationale of reversal and continuation signals and demonstrates the crucial importance of confirmation (in the form of other candlesticks, traditional technical signals, volume, momentum and moving averages). Michael C. Thomsett is a market expert, author, speaker and coach. His many books include Mathematics of Options, Real Estate Investor’s Pocket Calculator, and A Technical Approach to Trend Analysis. A video of the author titled "Candlesticks for Option Timing" can be found here: https://www.youtube.com/watch?v=IItH6OLh7TI

    Produktinformation

    • Utgivningsdatum:2017-12-19
    • Mått:155 x 230 x 20 mm
    • Vikt:525 g
    • Format:Häftad
    • Språk:Engelska
    • Antal sidor:320
    • Upplaga:17001
    • Förlag:De Gruyter
    • ISBN:9781501515804

    Utforska kategorier

    • Finansiering inom Ekonomi och Ledarskap

    Mer om författaren

    Michael C. Thomsett, Business and Investment Writer, Nashville, Tennessee, USA

    Innehållsförteckning

    • Chapter 1: The Basic Candlestick  1 The Origin and Meaning of the Candlestick  2 Strengths and Weaknesses of Candlesticks  7 Paper Trading as a Testing Ground  12 The Skills Every Trader Needs  15 Candlesticks: General Observations Concerning Their Use  19 Expanding the Information Pool Effectively  22 Chapter 2: Single Stick Signs  27 Uptrends and Downtrends  28 The Significance of a Candlestick’s Shape  31 Variations on the Bullish Long Candlestick  33 The Mistake Pattern  35 The Spinning Top, Hanging Man, and Hammer  41 Line Signals  44 The Significance of Tails  45 Chapter 3: Double Stick Moves  49 Two Reversal Moves: Engulfing and Harami  50 More Reversals: The Inverted Hammer and Doji Star  56 Gaps and Lines  60 Neck Lines, Crows, and Rabbits  68 Reversal and Confirming Moves—Relative Values  78 Chapter 4: Complex Stick Patterns  81 Reversal Trend Change Patterns  82 Inside and Outside Formations  88 Reversal Stars and Abandoned Babies  91 Line and Gap Continuation Signals  95 Tower Tops and Bottoms  105 Chapter 5: Reversal and Continuation Pattern Analysis  109 Strong Top and Bottom Signals  111 Stars, Kicks, Swallows, and Sandwiches  117 Matching and Star Reversals  126 Ladders and “Major” Reversals  130 Sakata’s Five Methods  134 Price Patterns with Low Reliability  142 Strong Price Line Reversals  150 Recognizing the False Signal  165 Chapter 6: Volume and Volatility  169 Volume as a Price Indicator  169 Volume Indicators  174 Testing Price Volatility  183 Triangles and Wedges  185 Chapter 7: Buy and Sell Set-Up Signals  193 Price Spikes and Reaction Swings  196 Percentage Swing Systems  200 Short-Term Gapping Behavior  202 Anticipating the Trend During Consolidation  206 The False Indicator  210 Support and Resistance in the Swing Trade  214 Chapter 8: Swing Trading with Candlesticks  219 A Swing Trading Overview  220 Quantifying Price Movement with Candlesticks  223 The Importance of Convergence and Divergence  226 Primary Trends and Candlestick-Based Entry or Exit  230 Set-Up Criteria and Action Points  234 Selling Short in Swing Trades  239 Chapter 9: Spotting Trends and Using Trendlines  243 Identifying the Trendline  244 Trendlines and Confirmation Signals  249 Applying Moving Averages to Candlestick Analysis  252 The Channel Line  254 Chapter 10: Technical Indicators  257 The Value of Confirmation  258 A Review: Technical Analysis Basics  261 The Significance of Gaps  264 A Framework for Interpretation: Support and Resistance  267 Overbought and Oversold Indicators  270 Relative Strength Index (RSI)  270 Stochastics  272 MACD  273 Bollinger Bands  274 The Potential of Candlestick Signals  278 Glossary  281 Index  297