• Fri frakt över 249 kr
  • •
  • Snabba leveranser
  • •
  • Billiga böcker
Kundservice

Du är på sajten för privatpersoner.

Företag, bibliotek eller offentlig verksamhet?

Du handlar på classic.bokus.com, där alla dina funktioner finns intakta.
Till classic.bokus.com
Bokus logotyp. Gå till startsidan.
  • Erbjudanden
  • Nyheter
  • Student
  • Topplistor
  • Barn & ungdom
  • Bokus Play
  • E-böcker
  • Pocketböcker
  • Spel & pussel

10% rabatt på allt med kod: NYSTART10 →

Sidfot

Mina sidor

    Hjälp

    • Kundservice
    • Vanliga frågor och svar
    • Frakt och leverans
    • Retur vid ångerrätt
    • Reklamera vara
    • Betalning
    • Köpvillkor
    • Allmänna villkor
    • Information om webbplatsens tillgänglighet

    Om Bokus

    • Om oss
    • Pressrum
    • För studenter
    • För företag
    • För bibliotek och offentlig verksamhet
    • För leverantörer
    • Hållbarhet

    Populärt

    • Aktuella erbjudanden
    • Presentkort
    • Studentlitteratur
    • Nya böcker
    • Topplistor
    • Signerade böcker
    • Engelska böcker

    Inspiration

    • Boktips
    • BookTok
    • Populära bokserier
    • Barnbokskaraktärer
    • Populära författare
    Logotyp för Bokus
    Följ oss på Facebook (extern länk)Följ oss på Instagram (extern länk)Följ oss på YouTube (extern länk)Följ oss på TikTok (extern länk)
    bokus @ CookiesAnpassa cookiesIntegritetspolicyKöpvillkor
    Till Citymail hemsida (extern länk)Till Budbee hemsida (extern länk)Till Postnord hemsida (extern länk)Till Schenker hemsida (extern länk)Till Early Bird hemsida (extern länk)Till Walleys hemsida (extern länk)
    1. Samhälle och politik
    2. Samhälle och kultur
    3. Kultur och medier
    4. Referensverk och tvärvetenskap

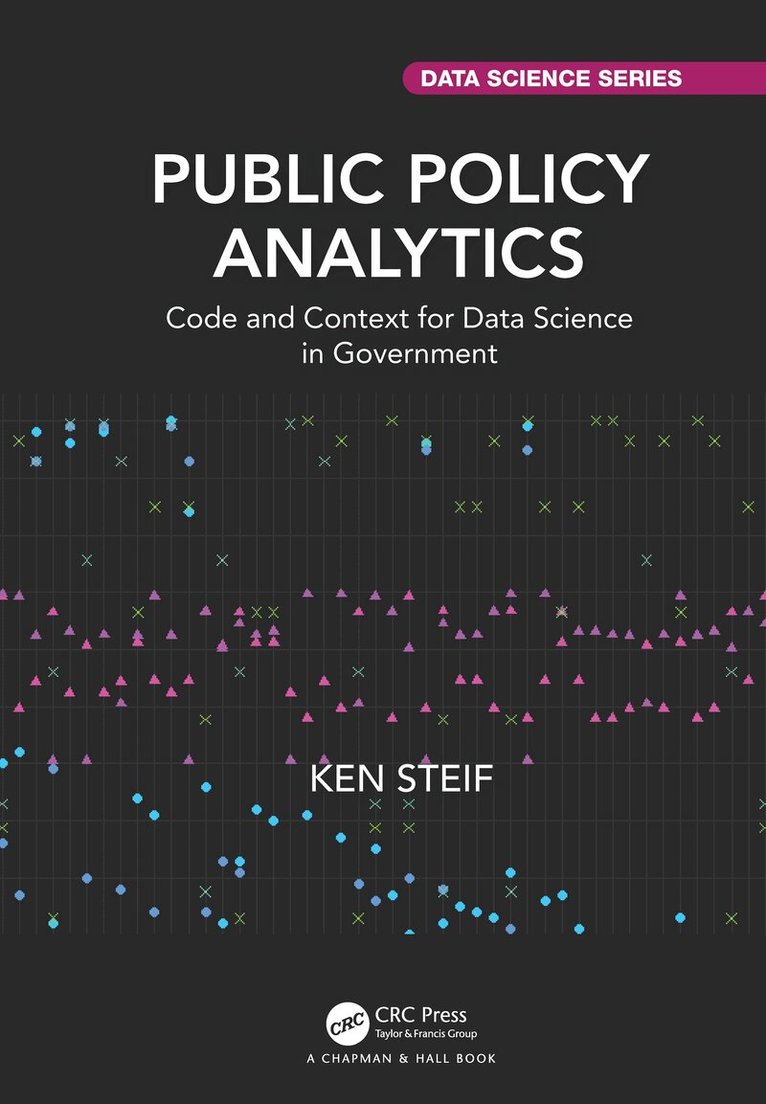
    Public Policy Analytics

    Code and Context for Data Science in Government

    AvKen Steif

    Inbunden, Engelska, 2021

    Del i serien Chapman & Hall/CRC Data Science Series

    2 056 kr

    Beställningsvara. Skickas inom 10-15 vardagar. Fri frakt över 249 kr.

    Fler format och utgåvor

    Häftad

    765 kr

    E-bok

    906 kr

    E-bok

    906 kr

    Beskrivning

    Public Policy Analytics: Code & Context for Data Science in Government teaches readers how to address complex public policy problems with data and analytics using reproducible methods in R. Each of the eight chapters provides a detailed case study, showing readers: how to develop exploratory indicators; understand ‘spatial process’ and develop spatial analytics; how to develop ‘useful’ predictive analytics; how to convey these outputs to non-technical decision-makers through the medium of data visualization; and why, ultimately, data science and ‘Planning’ are one and the same. A graduate-level introduction to data science, this book will appeal to researchers and data scientists at the intersection of data analytics and public policy, as well as readers who wish to understand how algorithms will affect the future of government.

    Produktinformation

    • Utgivningsdatum:2021-08-20
    • Mått:178 x 254 x undefined mm
    • Vikt:725 g
    • Format:Inbunden
    • Språk:Engelska
    • Serie:Chapman & Hall/CRC Data Science Series
    • Antal sidor:228
    • Förlag:Taylor & Francis Ltd
    • ISBN:9780367516253

    Utforska kategorier

    • Referensverk och tvärvetenskap inom Samhälle och politik
    • Informationsteknik: allmänt inom Data och IT
    • Databaser inom Data och IT

    Mer om författaren

    Ken Steif Ph.D is the Director of the Master of Urban Spatial Analytics program at the University of Pennsylvania and an Associate Professor of Practice in the City Planning Program. He teaches courses on the application of spatial analysis, statistics, predictive modeling and data visualization to solve traditional and contemporary public policy programs. Dr. Steif also is the founder of a consultancy that develops analytics for both public and private-sector clients. He lives in West Philadelphia with his wife Diana and sons Emil and Malcolm. You can follow him on Twitter @KenSteif.

    Recensioner i media

    Finally, a book that connects two parallel lessons. First, how to design geospatial data science workflows in the public policy sector; and second, when applying algorithms in government, there is no free lunch. Rather than making data science in government a bleak challenge suited only the fearless, Ken sustains a tone of optimism and a sense of purpose for readers curious enough to ponder the kernels of wisdom he has sprinkled in each chapter. -- Mark Wheeler, Chief Information Officer, City of PhiladelphiaPublic Policy Analytics is a must-read for creating data-driven urban plans and policies. In crisp and compelling chapters, Dr. Steif steps through real-world problems and links them to critical methods in R. The included assignments are perfect for both self-guided students and educators. There is no better guide to data science in the public realm! -- Dr. Allison Lassiter, Assistant Professor of City & Regional Planning, Univ. of PennsylvaniaKen Steif has written a clever and instructive text to guide students of planning and public policy decision-making. This accessible book brings data science and machine learning into the realm of public policy through a series of common and compelling “use cases,” with an emphasis on the critical role of geospatial analysis. The examples provided are practical, address important social issues, and demonstrate impact. Readers will appreciate the thoughtfulness of the prose and a narration sympathetic to the challenges of doing data science in a policy environment. -- Dr. Dennis Culhane, Dana and Andrew Stone Professor of Social Policy, Univ. of Pennsylvania

    Innehållsförteckning

    • Preface Introduction Indicators for Transit Oriented Development 1.1 Why Start With Indicators? 1.1.1 Mapping & scale bias in areal aggregate data 1.2 Setup 1.2.1 Downloading & wrangling Census data 1.2.2 Wrangling transit open data 1.2.3 Relating tracts & subway stops in space 1.3 Developing TOD Indicators 1.3.1 TOD indicator maps 1.3.2 TOD indicator tables 1.3.3 TOD indicator plots 1.4 Capturing three submarkets of interest 1.5 Conclusion: Are Philadelphians willing to pay for TOD? 1.6 Assignment - Study TOD in your city Expanding the Urban Growth Boundary2.1 Introduction - Lancaster development2.1.1 The bid-rent model2.1.2 Setup Lancaster data 2.2 Identifying areas inside & outside of the Urban Growth Area 2.2.1 Associate each inside/outside buffer with its respective town2.2.2 Building density by town & by inside/outside the UGA 2.2.3 Visualize buildings inside & outside the UGA2.3 Return to Lancaster’s Bid Rent 2.4 Conclusion - On boundaries 2.5 Assignment - Boundaries in your community Intro to geospatial machine learning, Part 1 3.1 Machine learning as a Planning tool 3.1.1 Accuracy & generalizability 3.1.2 The machine learning process 3.1.3 The hedonic model 3.2 Data wrangling - Home price & crime data 3.2.1 Feature Engineering - Measuring exposure to crime 3.2.2 Exploratory analysis: Correlation3.3 Introduction to Ordinary Least Squares Regression 3.3.1 Our first regression model3.3.2 More feature engineering & colinearity 3.4 Cross-validation & return to goodness of fit3.4.1 Accuracy - Mean Absolute Error 3.4.2 Generalizability - Cross-validation 3.5 Conclusion - Our first model 3.6 Assignment - Predict house prices Intro to geospatial machine learning, Part 24.1 On the spatial process of home prices 4.1.1 Setup & Data Wrangling 4.2 Do prices & errors cluster? The Spatial Lag4.2.1 Do model errors cluster? - Moran’s I4.3 Accounting for neighborhood 4.3.1 Accuracy of the neighborhood model 4.3.2 Spatial autocorrelation in the neighborhood model 4.3.3 Generalizability of the neighborhood model4.4 Conclusion - Features at multiple scalesGeospatial risk modeling - Predictive Policing 5.1 New predictive policing tools 5.1.1 Generalizability in geospatial risk models 5.1.2 From Broken Windows Theory to Broken Windows Policing 5.1.3 Setup 5.2 Data wrangling: Creating the fishnet5.2.1 Data wrangling: Joining burglaries to the fishnet 5.2.2 Wrangling risk factors 5.3 Feature engineering - Count of risk factors by grid cell 5.3.1 Feature engineering - Nearest neighbor features 5.3.2 Feature Engineering - Measure distance to one point 5.3.3 Feature Engineering - Create the final_net 5.4 Exploring the spatial process of burglary 5.4.1 Correlation tests 5.5 Poisson Regression 5.5.1 Cross-validated Poisson Regression 5.5.2 Accuracy & Generalzability 5.5.3 Generalizability by neighborhood context5.5.4 Does this model allocate better than traditional crime hotspots? 5.6 Conclusion - Bias but useful? 5.7 Assignment - Predict risk People-based ML models6.1 Bounce to work6.2 Exploratory analysis 6.3 Logistic regression6.3.1 Training/Testing sets 6.3.2 Estimate a churn model 6.4 Goodness of Fit 6.4.1 Roc Curves 6.5 Cross-validation 6.6 Generating costs and benefits 6.6.1 Optimizing the cost/benefit relationship 6.7 Conclusion - churn 6.8 Assignment - Target a subsidy People-Based ML Models: Algorithmic Fairness7.1 Introduction 7.1.1 The spectre of disparate impact 7.1.2 Modeling judicial outcomes 7.1.3 Accuracy and generalizability in recidivism algorithms 7.2 Data and exploratory analysis 7.3 Estimate two recidivism models 7.3.1 Accuracy & Generalizability 7.4 What about the threshold?7.5 Optimizing ‘equitable’ thresholds 7.6 Assignment - Memo to the Mayor Predicting rideshare demand8.1 Introduction - ride share 8.2 Data Wrangling - ride share 8.2.1 Lubridate8.2.2 Weather data 8.2.3 Subset a study area using neighborhoods 8.2.4 Create the final space/time panel 8.2.5 Split training and test8.2.6 What about distance features? 8.3 Exploratory Analysis - ride share 8.3.1 Trip_Count serial autocorrelation 8.3.2 Trip_Count spatial autocorrelation 8.3.3 Space/time correlation? 8.3.4 Weather8.4 Modeling and validation using purrr::map8.4.1 A short primer on nested tibbles 8.4.2 Estimate a ride share forecast 8.4.3 Validate test set by time 8.4.4 Validate test set by space 8.5 Conclusion - Dispatch8.6 Assignment - Predict bike share tripsConclusion - Algorithmic Governance Index