E-bok, Engelska, 2009
Data Mashups in R
56 kr
Läs direkt i Bokus Reader – eller ladda ned till din enhet (PDF kräver ofta zoom och scroll på små skärmar).
Beskrivning
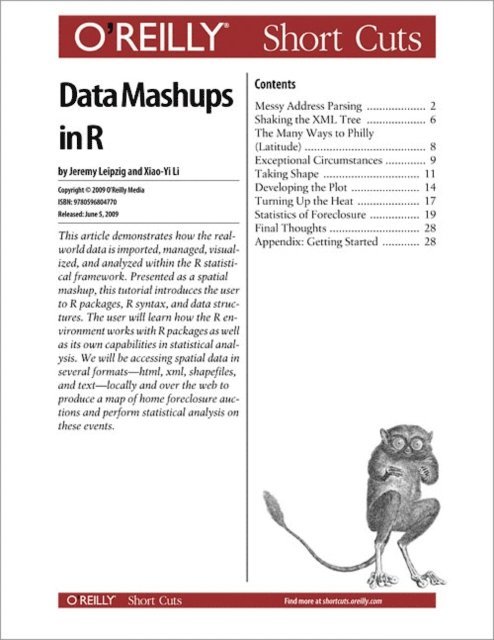
This article demonstrates how the realworld data is imported, managed, visualized, and analyzed within the R statistical framework. Presented as a spatial mashup, this tutorial introduces the user to R packages, R syntax, and data structures. The user will learn how the R environment works with R packages as well as its own capabilities in statistical analysis. We will be accessing spatial data in several formats-html, xml, shapefiles, and text-locally and over the web to produce a map of home foreclosure auctions and perform statistical analysis on these events.
Produktinformation
- Utgivningsdatum: 2009-06-05
- Språk: Engelska
- Filformat: PDF
- Kopieringsskydd: LCP
- ISBN: 9780596804770
- Förlag: O'Reilly Media
Utforska kategorier
Betyg & recensioner
0 recensioner
Inga recensioner tillgängliga.