Häftad, Engelska, 2013
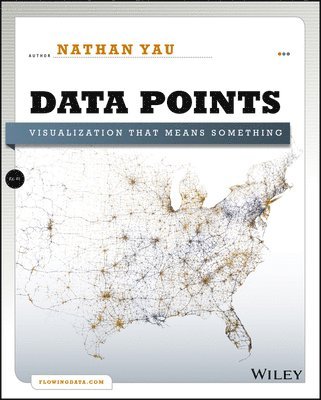
Data Points
Visualization That Means Something
Av Nathan Yau
325 kr
Beställningsvara. Skickas inom 7-10 vardagar. Fri frakt över 249 kr.
Beskrivning
Produktinformation
- Utgivningsdatum: 2013-04-15
- Mått: 189 x 233 x 17 mm
- Vikt: 731 g
- Format: Häftad
- Språk: Engelska
- Antal sidor: 320
- Förlag: John Wiley & Sons Inc
- ISBN: 9781118462195
Utforska kategorier
Mer om författaren
Nathan Yau has a PhD in statistics and is a statistical consultant who helps clients make use of their data through visualization. He created the popular site FlowingData.com, and is the author of Visualize This: The FlowingData Guide to Design, Visualization, and Statistics, also published by Wiley.
Recensioner i media
"Data Points opens an exciting view of information blending data analysis, visual interaction, and digital storytelling... the visuals are stunning." (Managing Information, October 2013) "Ultimately, I would recommend this book for anyone interested in the process of design and analysis. It is about making sense of data and that is becoming a crucial skill in this digital age." (Media Information & Technology Journal, August 2013) "A detailed handbook, Data Points is espe??cially useful for those working on scientific data visualization, guiding the reader through fascinat??ing examples of data, graph??ics, context, presentation and analytics. But this is more than a mere how-to manual. Yau reminds us that the real purpose of most visualiza??tion work is to communicate data to pragmatic ends." (Nature, May 2013)
Betyg & recensioner
0 recensioner
Inga recensioner tillgängliga.