• Fri frakt över 249 kr
  • •
  • Snabba leveranser
  • •
  • Billiga böcker
Kundservice

Du är på sajten för privatpersoner.

Företag, bibliotek eller offentlig verksamhet?

Du handlar på classic.bokus.com, där alla dina funktioner finns intakta.
Till classic.bokus.com
Bokus logotyp. Gå till startsidan.
  • Erbjudanden
  • Nyheter
  • Student
  • Topplistor
  • Barn & ungdom
  • Bokus Play
  • E-böcker
  • Pocketböcker
  • Spel & pussel

10% rabatt på allt med kod: NYSTART10 →

Sidfot

Mina sidor

    Hjälp

    • Kundservice
    • Vanliga frågor och svar
    • Frakt och leverans
    • Retur vid ångerrätt
    • Reklamera vara
    • Betalning
    • Köpvillkor
    • Allmänna villkor
    • Information om webbplatsens tillgänglighet

    Om Bokus

    • Om oss
    • Pressrum
    • För studenter
    • För företag
    • För bibliotek och offentlig verksamhet
    • För leverantörer
    • Hållbarhet

    Populärt

    • Aktuella erbjudanden
    • Presentkort
    • Studentlitteratur
    • Nya böcker
    • Topplistor
    • Signerade böcker
    • Engelska böcker

    Inspiration

    • Boktips
    • BookTok
    • Populära bokserier
    • Barnbokskaraktärer
    • Populära författare
    Logotyp för Bokus
    Följ oss på Facebook (extern länk)Följ oss på Instagram (extern länk)Följ oss på YouTube (extern länk)Följ oss på TikTok (extern länk)
    bokus @ CookiesAnpassa cookiesIntegritetspolicyKöpvillkor
    Till Citymail hemsida (extern länk)Till Budbee hemsida (extern länk)Till Postnord hemsida (extern länk)Till Schenker hemsida (extern länk)Till Early Bird hemsida (extern länk)Till Walleys hemsida (extern länk)
    1. Ekonomi och Ledarskap
    2. Företagsekonomi
    3. Affärsförhandlingar

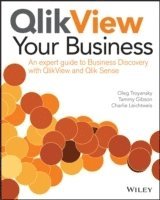
    QlikView Your Business

    An Expert Guide to Business Discovery with QlikView and Qlik Sense

    AvOleg Troyansky,Tammy Gibson

    Häftad, Engelska, 2015

    592 kr

    Tillfälligt slut

    Beskrivning

    Unlock the meaning of your data with QlikViewThe Qlik platform was designed to provide a fast and easy data analytics tool, and QlikView Your Business is your detailed, full-color, step-by-step guide to understanding Qlikview's powerful features and techniques so you can quickly start unlocking your data’s potential. This expert author team brings real-world insight together with practical business analytics, so you can approach, explore, and solve business intelligence problems using the robust Qlik toolset and clearly communicate your results to stakeholders using powerful visualization features in QlikView and Qlik Sense.This book starts at the basic level and dives deep into the most advanced QlikView techniques, delivering tangible value and knowledge to new users and experienced developers alike. As an added benefit, every topic presented is enhanced with tips, tricks, and insightful recommendations that the authors accumulated through years of developing QlikView analytics. This is the book for you: If you are a developer whose job is to load transactional data into Qlik BI environment, and who needs to understand both the basics and the most advanced techniques of Qlik data modelling and scriptingIf you are a data analyst whose job is to develop actionable and insightful QlikView visualizations to share within your organizationIf you are a project manager or business person, who wants to get a better understanding of the Qlik Business Intelligence platform and its capabilitiesWhat You Will Learn:The book covers three common business scenarios - Sales, Profitability, and Inventory Analysis. Each scenario contains four chapters, covering the four main disciplines of business analytics: Business Case, Data Modeling, Scripting, and Visualizations. The material is organized by increasing levels of complexity. Following our comprehensive tutorial, you will learn simple and advanced QlikView and Qlik Sense concepts, including the following:Data Modeling: Transforming Transactional data into Dimensional modelsBuilding a Star SchemaLinking multiple fact tables using Link TablesCombing multiple tables into a single fact able using Concatenated Fact modelsManaging slowly changing dimensionsAdvanced date handling, using the As of Date tableCalculating running balancesBasic and Advanced Scripting: How to use the Data Load Script language for implementing data modeling techniquesHow to build and use the QVD data layerBuilding a multi-tier data architecturesUsing variables, loops, subroutines, and other script control statementsAdvanced scripting techniques for a variety of ETL solutionsBuilding Insightful Visualizations in QlikView: Introduction into QlikView sheet objects — List Boxes, Text Objects, Charts, and moreDesigning insightful Dashboards in QlikViewUsing advanced calculation techniques, such as Set Analysis and Advanced AggregationUsing variables for What-If Analysis, as well as using variables for storing calculations, colors, and selection filtersAdvanced visualization techniques - normalized and non-normalized Mekko charts, Waterfall charts, Whale Tail charts, and moreBuilding Insightful Visualizations in Qlik Sense: Introducing Qlik Sense - how it is different from QlikView and what is similar?Creating Sense sheet objectsBuilding and using the Library of Master ItemsExploring Qlik Sense unique features — Storytelling, Geo Mapping, and using ExtensionsWhether you are just starting out with QlikView or are ready to dive deeper, QlikView Your Business is your comprehensive guide to sharpening your QlikView skills and unleashing the power of QlikView in your organization.

    Produktinformation

    • Utgivningsdatum:2015-10-09
    • Mått:180 x 226 x 41 mm
    • Vikt:1 315 g
    • Format:Häftad
    • Språk:Engelska
    • Antal sidor:800
    • Förlag:John Wiley & Sons Inc
    • Medarbetare:Lars Bjork
    • ISBN:9781118949559

    Utforska kategorier

    • Affärsförhandlingar inom Ekonomi och Ledarskap
    • Affärsapplikationer inom Data och IT

    Mer om författaren

    OLEG TROYANSKY is the President of Natural Synergies, the first North American BI firm that was created with the focus on QlikView solutions, services and education. He is a well-known QlikView educator and advocate, a 2014 QlikView luminary and a speaker at the Masters Summit for QlikView.TAMMY GIBSON is a Senior QlikView Consultant at Natural Synergies. She's been developing QlikView solutions since 2004. She is also the co-founder and CTO of VenueCube, a company providing business intelligence analytics to entertainment venues and convention centers.CHARLES LEICHTWEIS is a Senior Advisor of Phoenix Strategic Advisors and the head of their Sustainable Profitable Growth Practice. Charlie has led companies in a variety of "C" suite roles in a career that spans 30 plus years. He holds an MBA in Operations Management, and is a CPA and CMA.

    Innehållsförteckning

    • Foreword xiiiIntroduction xvPART I Getting StartedChapter 1 The Needs and Challenges of Business Intelligence and Analytics 3The Case for Business Intelligence 4Common Challenges of Business Analytics 6How Successful Businesses Use Business Intelligence 7Introducing the Six Process Spheres 7Identifying Business Measures 10What Companies Gain from Implementing BI 14The Business Scenario Used in the Book 16Chapter 2 Why Use Qlik for Data Discovery and Analytics? 17The Evolution of BI 18Traditional Business Intelligence (OLAP) 18Qlik’s Disruptive Approach to BI 20Data Discovery Is the New Black 22QlikView 11 Overview 23In-Memory Storage Means No Need for Pre-Calculated Cubes 23An Interactive User Experience 24Associative Logic Powers Data Discovery 26Right-Sized Analytics 32Qlik Sense Overview 32PART II Learning the Core Techniques: Sales AnalysisChapter 3 Defining a Business Scenario for Sales Analysis 41“What Do You Mean When You Say Sales?” 42What Is the Real Value of the Sale? 43What Happened? 45Why Did it Happen? What Does It Mean forMy Business? 46What Data Is Needed 50Advanced Sales Analysis Makes the Data Visible and Available 51Chapter 4 Visualizing Sales Analysis in QlikView 53Preparing the Environment and Getting Ready 54Opening a Template Document 54Sheets and Sheet Objects 57Working with Colors in QlikView 59List Boxes, Text Objects, andOther Sheet Objects 60Introducing List Boxes and Multi Boxes 61Table Box and How It Should (Not) Be Used 65Using Text Objects for Labels, Images, and Backgrounds 66Line/Arrow Object 69Mind Your Selections: Search Object and Current Selections Box 70Organizing and Arranging Objects on the Screen 73Developing Simple Charts in QlikView 78Main Components of QlikView Charts 79Using Bar Charts to Compare Outcomes Among Brands,Channels, and Salespeople 82Using Line Charts to Visualize Trends over Time 92Using Pie Charts to Visualize Distribution of the WholeBetween its Parts 97Using Straight Tables and Pivot Tables to Show Details 100First Round of Improvements 111Gathering Feedback at the First Application Review 111Using Groups to Add Flexibility to Your Charts 113Comparing YTD to Prior YTD or Other Conditions 118Building Dashboards 129Bringing It All Together 140Chapter 5 Data Modeling for Sales Analysis 145Data Modeling Basics 146The Transactional Software Class 147Using ETL to Populate Dimensional Tables 155Designing a Data Model for Sales Analysis 159Tips Before You Start Scripting 168Chapter 6 Developing a Data Load Script for Sales Analysis 169Load Script and Script Editor 170Script Editor Basics in QlikView 170Anatomy of a QlikView SQL Select Statement 177Organizing Your Script 179Using the Table Viewer and Understanding the Data Model 186Resolving Simple Challenges in Data Load 188Introducing Synthetic Keys and Circular References 189Avoiding Synthetic Keys by Renaming Fields 191Using the QUALIFY and UNQUALIFY Commands 192A Few Words About Naming Conventions 196Transforming the Data Model 197Loading Data from a Spreadsheet 198Enhancing the Data Model for Online Analytics 204Joining Two Tables into One 207Adding Calculated Fields 213Additional Transformations: Calculating Conditional Flags 222Adding a Master Calendar Table Using INCLUDE 233PART III Expanding Your Skill Set: Profitability AnalysisChapter 7 Defining a Business Scenario for Profitability Analysis 241The Profit and Loss Statement 242The Direct Variable Profitability (DVP) Model 245Deep Dive Example 248Use of Business Intelligence Tools Makes the Data Visible and Available 251Chapter 8 Visualizing Profitability Analysis in QlikView 253Simple Visualizations for Profitability Analysis 254Preparing the Template for Profitability Analysis 254Preparing the Expressions for Profitability Calculations 256Revisiting Simple Visualization Objects 286Learning Advanced Visualizations 292Visualizing Components of Costs and Profits 292How to Visualize Correlations Between Sales and Profits 308Advanced Visualizations Using Set Analysis 339Using Containers as an Alternative to Auto-Minimized Charts 349Chapter 9 Data Modeling for Profitability Analysis 355How QlikView Stores Data 356Modeling Multiple Transaction Sources 361Multiple Fact Tables 362The Concatenated Fact Table 369Working With Dimensions 370Slowly Changing Dimensions Defined 371Product Costs as Dimension Attributes 373Product Costs as Fact Metrics 375Chapter 10 Developing a Data Load Script for Profitability Analysis 379Creating a QVD Data Layer 380Why Do You Need a Separate Data Layer? 380Introducing the QVD File Format 381Variables and Script Control Statements 384Troubleshooting QlikView Load Scripts 406Creating Transformed QVD Files for Profitability Data 411Generating New Transformed QVDs 415Building the Data Model for Profitability Analysis 416An Overview of the Process 417Aggregating Data in QlikView 418How to Use Mapping in QlikView Script 420Using Aggregation and Mapping to Load the Credit Memos 425Building the Link Table 431Building the Master Calendar 439A Few Words About Link Tables 452A Round of Improvements 455Modifying the Data Model to Restore Missing Associations 456Loading Complex Spreadsheets 457Adding Commissions Data to the Data Model 470Explaining the Multi-Tier Data Architecture 471PART IV Mastering Advanced Techniques: Inventory AnalysisChapter 11 Defining a Business Scenario for Inventory Analysis 477What Is Inventory—Asset or Liability? 477Factors to Consider When Measuring Inventory 479The Definition of Inventory Analysis 481Commonly Used Metrics for Inventory Analysis 482Common Data Elements Required for Inventory Analysis 484The Benefits of Advanced Inventory Analysis 485Chapter 12 Visualizing Inventory Analysis in QlikView 489Developing the Key Measures for Inventory Analysis 490Preparing the Environment for Inventory Analysis 490Using Advanced Aggregation (AGGR) forInventory Measures 500Enhancing Visual Analysis with Advanced Aggregation 513Developing Histograms 513Visualizing Parts of Totals and Subtotals 518Bucket Analysis 536Does It Get Any More Advanced with Advanced Aggregation and Advanced Set Analysis? 542Comparing TOTAL with AGGR() 542Using TOTAL and AGGR() with Dimensions Outside of the Chart Data 545More About Advanced Set Analysis 548Comparative Analysis Using Alternate States 556Declaring Alternate States 556Assigning Objects to Alternate States 557Using Alternate States in Combination with Set Analysis 560Combining Selections from Multiple States 561Getting Advanced with Straight Tables 563Using Gauges in Straight Tables 564Mini Charts (Sparklines) 567Adding Images to Straight Tables 570Adding Links (URLs) to Straight Tables 574Advanced Presentation Features—Buttons, Actions, and Triggers 577Buttons and Actions 578Using Show Conditions and Calculation Conditions 582Using Buttons, Actions, and Show Conditions to Develop AdvancedNavigation Features 583Chapter 13 Data Modeling for Inventory Analysis 589Calculating Running Balances 590The Logic of Calculating a Running Balance 590How Running Balances Apply to Inventory and Inventory Aging 591The Concatenated Fact Table 593Introducing the Concatenated Fact Table 593Resolve Missing Associations 596Forcing Alignment with Link Tables and Generic Keys 598Link Tables or Concatenated Facts? 600Advanced Date Handling 601Should Date Flags Reside in the Master Calendar or in the Fact Table? 601Supporting Flexible “As Of” Dates 604Chapter 14 Developing a Data Load Script for Inventory Analysis 607Review of the Business Requirements and the Data Sources 608Transforming Inventory Data 610The Process of Generating the Aging Data 610Transforming Sales Data for Inventory Analysis 616Transforming On-Hand Balances and On-Hand History Data 626Storing the Transformed QVD Files 627Building the Concatenated Fact Table 628Combining Multiple Facts in a Single Table 628Propagating Missing Attributes to All the Slices of the Concatenated Fact 632Adding Dimension Tables and Calculated Fields 635Restoring Missing Associations 640Building the As Of Date Table 648Generating Chart Expressions in the Script 654Creating Expressions Stored in Variables in the Script 655Loading Expressions from External Text Files 660A Few Words in Conclusion 667Presentation Features Not Covered in the Book 668Scripting Features Not Covered in the Book 669PART V Qlik SenseChapter 15 Loading Data in Qlik Sense 673Getting Oriented with Qlik Sense 674Introducing the Desktop Hub 674Create a New App 676Using Quick Data Load 678The QDL Wizard 678Drag and Drop 679Using the Data Load Editor 681Navigation and Layout 682Introducing Data Connections 683Loading Data from QlikView into Qlik Sense 689Loading Data for Sales Analysis 690Using Developer Tools 695Data Model Viewer 695Debug Panel 698Chapter 16 Developing Visualizations in Qlik Sense 701Exploring the Qlik Sense Visual Environment 702Navigation in Qlik Sense 702Building Simple Charts 703Introducing the Library of Master Items 707Developing the Sales Analysis Dashboard in Qlik Sense 713Building More Advanced Analytics in Qlik Sense 721Selections in Qlik Sense 728Making Selections in Charts 728Working with Current Selections 729The Search and Selections Tools 730Introducing the Filter Pane 732Storytelling 733Taking Snapshots 733Creating Stories 735Using Story Playback 737Geo-Mapping in Qlik Sense 738Loading Geography Data 738Creating Maps 743Integrating Qlik Sense Apps 749Defining Qlik Sense Integration Terminology 749Integrating Extensions in Qlik Sense 750Exploring the Feature of Converting Charts 752Where to Find More Extensions and More Information 753What About Mashups? 754Appendix What’s Next? 755Index 759