E-bok, Engelska, 2014
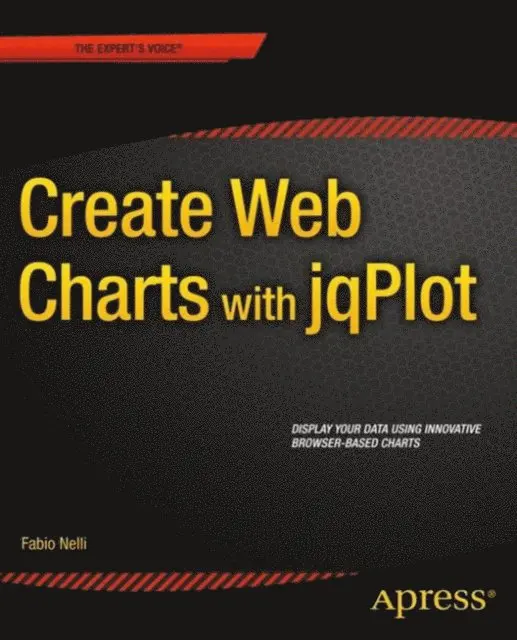
Create Web Charts with jqPlot
Av Fabio Nelli
542 kr
Läs direkt i Bokus Reader – eller ladda ned till din enhet (PDF kräver ofta zoom och scroll på små skärmar).
Beskrivning
Create Web Charts with jqPlotshows how to convert your data into eye-catching, innovative, animated, and highly interactive browser-based charts. This book is suitable for developers of all experience levels and needs: for those who love fast and effective solutions, you can use the jqPlot library to generate charts with amazing effects and animations using only a few lines of code.
By the end of the book, you will have a good knowledge of all the elements needed to manage data from every possible source, from high-end scientific instruments to Arduino boards, from simple HTML tables to structured JSON files, and from Matlab calculations to reports in Excel. You will be able to provide cutting-edge charts exploiting the growing power of modern browsers.
This book contains content previously published in Beginning JavaScript Charts.
- Create all kinds of charts using the latest technologies available on browsers
- Full of step-by-step examples, Create Web Charts with jqPlot introduces you gradually to all aspects of chart development, from the data source to the choice of which solution to apply.
- This book provides a number of tools that can be the starting point for any project requiring graphical representations of data, whether using commercial libraries or your own
Produktinformation
- Utgivningsdatum: 2014-11-26
- Språk: Engelska
- Filformat: PDF
- Kopieringsskydd: LCP
- ISBN: 9781484208625
- Förlag: Apress
Utforska kategorier
Betyg & recensioner
0 recensioner
Inga recensioner tillgängliga.