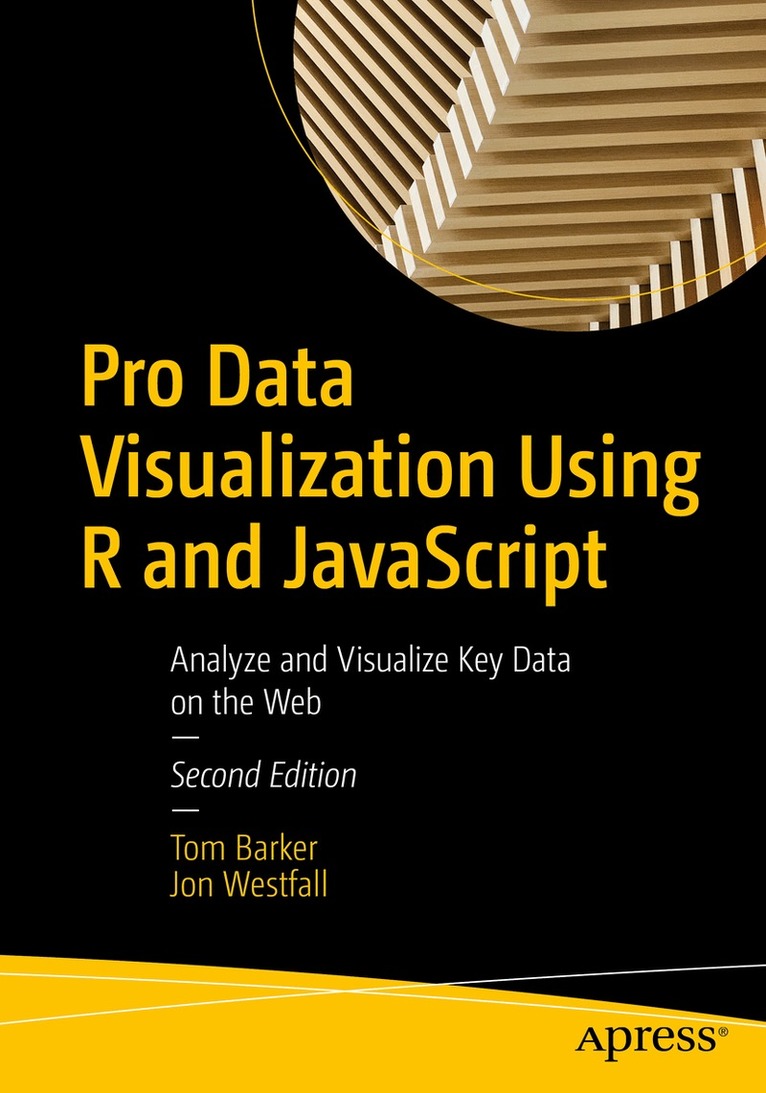
Häftad, Engelska, 2021
Pro Data Visualization Using R and JavaScript
Analyze and Visualize Key Data on the Web
623 kr
Beställningsvara. Skickas inom 10-15 vardagar. Fri frakt över 249 kr.
Beskrivning
Produktinformation
- Utgivningsdatum: 2021-10-08
- Mått: 178 x 254 x 16 mm
- Vikt: 554 g
- Format: Häftad
- Språk: Engelska
- Antal sidor: 274
- Upplaga: 2
- Förlag: APress
- ISBN: 9781484272015
Utforska kategorier
Mer om författaren
Tom Barker is an engineer, a professor and an author. Currently he is Sr Manager of Web Development at Comcast, and an instructor at Philadelphia University. He has authored several books on web development including Pro JavaScript Performance: Monitoring and Visualization, and Pro Data Visualization with JavaScript and R.Matthew Campbell has worked on data visualization and dashboards with a data science team using RStudio. He got his start with technology after college when he learned SAS to do statistical programming at the Educational Testing Service (ETS). Learning this programming language kicked off a lifelong obsession with technology.
Recensioner i media
“This book offers a gradual introduction to data visualization by using R to analyse data and R and D3 Javascript libraries to format and make data visually interesting. … this book is a practical tool to implement data visualization solution for standard charts in R and D3 JS with programs allowing the reader to test and implement these solutions, and also to improve them their own use.” (Sébastien Bailly, ISCB News, iscb.info, June, 2022)
Betyg & recensioner
0 recensioner
Inga recensioner tillgängliga.