• Fri frakt över 249 kr
  • •
  • Snabba leveranser
  • •
  • Billiga böcker
Kundservice

Du är på sajten för privatpersoner.

Företag, bibliotek eller offentlig verksamhet?

Du handlar på classic.bokus.com, där alla dina funktioner finns intakta.
Till classic.bokus.com
Bokus logotyp. Gå till startsidan.
  • Erbjudanden
  • Nyheter
  • Student
  • Topplistor
  • Barn & ungdom
  • Bokus Play
  • E-böcker
  • Pocketböcker
  • Spel & pussel

10% rabatt på allt med kod: NYSTART10 →

Sidfot

Mina sidor

    Hjälp

    • Kundservice
    • Vanliga frågor och svar
    • Frakt och leverans
    • Retur vid ångerrätt
    • Reklamera vara
    • Betalning
    • Köpvillkor
    • Allmänna villkor
    • Information om webbplatsens tillgänglighet

    Om Bokus

    • Om oss
    • Pressrum
    • För studenter
    • För företag
    • För bibliotek och offentlig verksamhet
    • För leverantörer
    • Hållbarhet

    Populärt

    • Aktuella erbjudanden
    • Presentkort
    • Studentlitteratur
    • Nya böcker
    • Topplistor
    • Signerade böcker
    • Engelska böcker

    Inspiration

    • Boktips
    • BookTok
    • Populära bokserier
    • Barnbokskaraktärer
    • Populära författare
    Logotyp för Bokus
    Följ oss på Facebook (extern länk)Följ oss på Instagram (extern länk)Följ oss på YouTube (extern länk)Följ oss på TikTok (extern länk)
    bokus @ CookiesAnpassa cookiesIntegritetspolicyKöpvillkor
    Till Citymail hemsida (extern länk)Till Budbee hemsida (extern länk)Till Postnord hemsida (extern länk)Till Schenker hemsida (extern länk)Till Early Bird hemsida (extern länk)Till Walleys hemsida (extern länk)
    1. Data och IT
    2. Människa – datorinteraktion

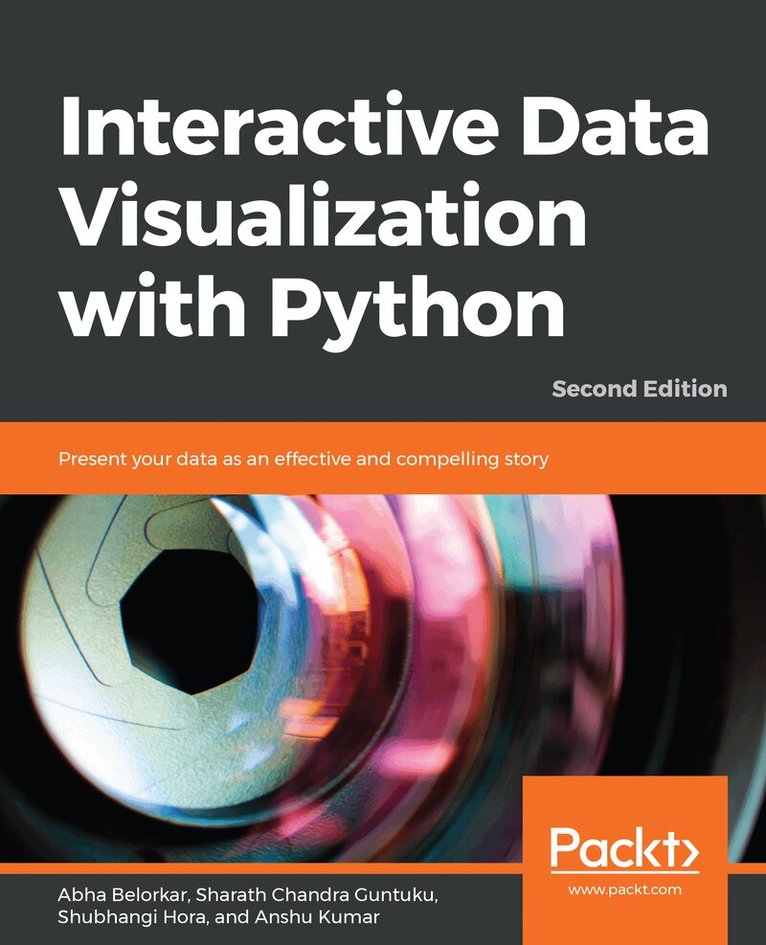
    Interactive Data Visualization with Python

    Present your data as an effective and compelling story

    AvAbha Belorkar,Sharath Chandra Guntuku

    Häftad, Engelska, 2020

    649 kr

    Beställningsvara. Skickas inom 5-8 vardagar. Fri frakt över 249 kr.

    Beskrivning

    Create your own clear and impactful interactive data visualizations with the powerful data visualization libraries of PythonKey FeaturesStudy and use Python interactive libraries, such as Bokeh and PlotlyExplore different visualization principles and understand when to use which oneCreate interactive data visualizations with real-world dataBook DescriptionWith so much data being continuously generated, developers, who can present data as impactful and interesting visualizations, are always in demand. Interactive Data Visualization with Python sharpens your data exploration skills, tells you everything there is to know about interactive data visualization in Python.You'll begin by learning how to draw various plots with Matplotlib and Seaborn, the non-interactive data visualization libraries. You'll study different types of visualizations, compare them, and find out how to select a particular type of visualization to suit your requirements. After you get a hang of the various non-interactive visualization libraries, you'll learn the principles of intuitive and persuasive data visualization, and use Bokeh and Plotly to transform your visuals into strong stories. You'll also gain insight into how interactive data and model visualization can optimize the performance of a regression model.By the end of the course, you'll have a new skill set that'll make you the go-to person for transforming data visualizations into engaging and interesting stories.What you will learnExplore and apply different interactive data visualization techniquesManipulate plotting parameters and styles to create appealing plotsCustomize data visualization for different audiencesDesign data visualizations using interactive librariesUse Matplotlib, Seaborn, Altair and Bokeh for drawing appealing plotsCustomize data visualization for different scenariosWho this book is forThis book intends to provide a solid training ground for Python developers, data analysts and data scientists to enable them to present critical data insights in a way that best captures the user's attention and imagination. It serves as a simple step-by-step guide that demonstrates the different types and components of visualization, the principles, and techniques of effective interactivity, as well as common pitfalls to avoid when creating interactive data visualizations. Students should have an intermediate level of competency in writing Python code, as well as some familiarity with using libraries such as pandas.

    Produktinformation

    • Utgivningsdatum:2020-04-14
    • Mått:191 x 235 x 20 mm
    • Vikt:676 g
    • Format:Häftad
    • Språk:Engelska
    • Antal sidor:362
    • Upplaga:2
    • Förlag:Packt Publishing Limited
    • ISBN:9781800200944

    Utforska kategorier

    • Människa – datorinteraktion inom Data och IT
    • Programspråk inom Data och IT

    Mer om författaren

    Abha Belorkar is an educator and researcher in computer science. She received her bachelor's degree in computer science from Birla Institute of Technology and Science Pilani, India and her Ph.D. from the National University of Singapore. Her current research work involves the development of methods powered by statistics, machine learning, and data visualization techniques to derive insights from heterogeneous genomics data on neurodegenerative diseases. Sharath Chandra Guntuku is a researcher in natural language processing and multimedia computing. He received his bachelor's degree in computer science from Birla Institute of Technology and Science, Pilani, India and his Ph.D. from Nanyang Technological University, Singapore. His research aims to leverage large-scale social media image and text data to model social health outcomes and psychological traits. He uses machine learning, statistical analysis, natural language processing, and computer vision to answer questions pertaining to health and psychology in individuals and communities. Shubhangi Hora is a data scientist, Python developer, and published writer. With a background in computer science and psychology, she is particularly passionate about healthcare-related AI, including mental health. Shubhangi is also a trained musician. Anshu Kumar is a data scientist with over 5 years of experience in solving complex problems in natural language processing and recommendation systems. He has an M.Tech. from IIT Madras in computer science. He is also a mentor at SpringBoard. His current interests are building semantic search, text summarization, and content recommendations for large-scale multilingual datasets.

    Innehållsförteckning

    • Table of ContentsIntroduction to Visualization with Python-Basic and Customized PlottingStatic Visualization - Global Patterns and Summary StatisticsFrom Static to Dynamic VisualizationInteractive Visualization of Data across StrataInteractive Visualization of Data across TimeInteractive Visualization of Data across Geographical RegionsAvoiding Common Pitfalls to Create Interactive Visualization