Thomas N. Bulkowski – författare
Encyclopedia of Candlestick Charts
1 223 kr
Skickas inom 5-8 vardagar
1 552 kr
Läs direkt efter köp
1 100 kr
Läs direkt efter köp
Trading Classic Chart Patterns
886 kr
Skickas inom 5-8 vardagar
561 kr
Läs direkt efter köp
The step-by-step visual guide to spotting potential price movements and improving returns
Bloomberg Visual Guide to Chart Patterns is a concise and accessible visual guide to identifying, understanding, and using chart patterns to predict the direction and extent of price moves. Packed with visual learning enhancements and exercises, this innovative book helps savvy investors and professionals alike master the essential skills of chart pattern recognition. Follow along as chart pattern expert Thomas Bulkowski teaches you to recognize important peaks and valleys that form patterns—footprints of the smart money.
Nearly 200 color charts assist in providing a step-by-step approach to finding those footprints, interpreting them, and following them. Popular patterns such as head-and-shoulders, double tops and bottoms, triangles, gaps, flags, and pennants are just a few of the many patterns explored throughout the book.
For the sophisticated trader or investor, the book also provides statistical research to support the claims of pattern behavior, trading signals, and setups, in an easy to understand way.
Discusses chart pattern identification guidelines, psychology, variations, failures, and buy and sell signals Covers the most popular and common chart patterns as well as lesser-known ones like throwbacks, pullbacks, and busted patterns Incorporates quizzes, step-by-step exercises, enhanced graphics and video tutorials to immerse the reader in the world of chart patternsDesigned for use by investors and traders, from beginners to experts looking for a practical, easy-to-use guide, comprehensive reference, Bloomberg Visual Guide to Chart Patterns provides a sophisticated introduction to the world of chart patterns.
581 kr
Läs direkt efter köp
The step-by-step visual guide to spotting potential price movements and improving returns
Bloomberg Visual Guide to Chart Patterns is a concise and accessible visual guide to identifying, understanding, and using chart patterns to predict the direction and extent of price moves. Packed with visual learning enhancements and exercises, this innovative book helps savvy investors and professionals alike master the essential skills of chart pattern recognition. Follow along as chart pattern expert Thomas Bulkowski teaches you to recognize important peaks and valleys that form patterns—footprints of the smart money.
Nearly 200 color charts assist in providing a step-by-step approach to finding those footprints, interpreting them, and following them. Popular patterns such as head-and-shoulders, double tops and bottoms, triangles, gaps, flags, and pennants are just a few of the many patterns explored throughout the book.
For the sophisticated trader or investor, the book also provides statistical research to support the claims of pattern behavior, trading signals, and setups, in an easy to understand way.
Discusses chart pattern identification guidelines, psychology, variations, failures, and buy and sell signals Covers the most popular and common chart patterns as well as lesser-known ones like throwbacks, pullbacks, and busted patterns Incorporates quizzes, step-by-step exercises, enhanced graphics and video tutorials to immerse the reader in the world of chart patternsDesigned for use by investors and traders, from beginners to experts looking for a practical, easy-to-use guide, comprehensive reference, Bloomberg Visual Guide to Chart Patterns provides a sophisticated introduction to the world of chart patterns.
1 498 kr
Läs direkt efter köp
Fundamental Analysis and Position Trading
Evolution of a Trader
594 kr
Skickas inom 5-8 vardagar
Trading Basics
Evolution of a Trader
594 kr
Skickas inom 5-8 vardagar
Swing and Day Trading
Evolution of a Trader
594 kr
Skickas inom 5-8 vardagar
734 kr
Läs direkt efter köp
Evolution of a Trader explores the four trading styles that people use when learning to trade or invest in the stock market. Often, beginners enter the stock market by:
Buying and holding onto a stock (value investing). That works well until the trend ends or a bear market begins. Then they try Position trading. This is the same as buy-and-hold, except the technique sells positions before a significant trend change occurs. Swing trading follows when traders increase their frequency of trading, trying to catch the short-term up and down swings. Finally, people try Day trading by completing their trades in a single day.This series provides comprehensive coverage of the four trading styles by offering numerous tips, sharing discoveries, and discussing specific trading setups to help you become a successful trader or investor as you journey through each style.
Trading Basics takes an in-depth look at money management, stops, support and resistance, and offers dozens of tips every trader should know.
Fundamental Analysis and Position Trading discusses when to sell a buy-and-hold position, uncovers which fundamentals work best, and uses them to find stocks that become 10-baggers—stocks that climb by 10 times their original value.
Swing and Day Trading reveals methods to time the market swings, including specific trading setups, but it covers the basics as well, such as setting up a home trading office and how much money you can make day trading.
708 kr
Läs direkt efter köp
Evolution of a Trader explores the four trading styles that people use when learning to trade or invest in the stock market. Often, beginners enter the stock market by:
Buying and holding onto a stock (value investing). That works well until the trend ends or a bear market begins. Then they try Position trading. This is the same as buy-and-hold, except the technique sells positions before a significant trend change occurs. Swing trading follows when traders increase their frequency of trading, trying to catch the short-term up and down swings. Finally, people try Day trading by completing their trades in a single day.This series provides comprehensive coverage of the four trading styles by offering numerous tips, sharing discoveries, and discussing specific trading setups to help you become a successful trader or investor as you journey through each style.
Trading Basics takes an in-depth look at money management, stops, support and resistance, and offers dozens of tips every trader should know.
Fundamental Analysis and Position Trading discusses when to sell a buy-and-hold position, uncovers which fundamentals work best, and uses them to find stocks that become 10-baggers—stocks that climb by 10 times their original value.
Swing and Day Trading reveals methods to time the market swings, including specific trading setups, but it covers the basics as well, such as setting up a home trading office and how much money you can make day trading.
734 kr
Läs direkt efter köp
Evolution of a Trader explores the four trading styles that people use when learning to trade or invest in the stock market. Often, beginners enter the stock market by:
Buying and holding onto a stock (value investing). That works well until the trend ends or a bear market begins. Then they try Position trading. This is the same as buy-and-hold, except the technique sells positions before a significant trend change occurs. Swing trading follows when traders increase their frequency of trading, trying to catch the short-term up and down swings. Finally, people try Day trading by completing their trades in a single day.This series provides comprehensive coverage of the four trading styles by offering numerous tips, sharing discoveries, and discussing specific trading setups to help you become a successful trader or investor as you journey through each style.
Trading Basics takes an in-depth look at money management, stops, support and resistance, and offers dozens of tips every trader should know.
Fundamental Analysis and Position Trading discusses when to sell a buy-and-hold position, uncovers which fundamentals work best, and uses them to find stocks that become 10-baggers—stocks that climb by 10 times their original value.
Swing and Day Trading reveals methods to time the market swings, including specific trading setups, but it covers the basics as well, such as setting up a home trading office and how much money you can make day trading.
708 kr
Läs direkt efter köp
Evolution of a Trader explores the four trading styles that people use when learning to trade or invest in the stock market. Often, beginners enter the stock market by:
Buying and holding onto a stock (value investing). That works well until the trend ends or a bear market begins. Then they try Position trading. This is the same as buy-and-hold, except the technique sells positions before a significant trend change occurs. Swing trading follows when traders increase their frequency of trading, trying to catch the short-term up and down swings. Finally, people try Day trading by completing their trades in a single day.This series provides comprehensive coverage of the four trading styles by offering numerous tips, sharing discoveries, and discussing specific trading setups to help you become a successful trader or investor as you journey through each style.
Trading Basics takes an in-depth look at money management, stops, support and resistance, and offers dozens of tips every trader should know.
Fundamental Analysis and Position Trading discusses when to sell a buy-and-hold position, uncovers which fundamentals work best, and uses them to find stocks that become 10-baggers—stocks that climb by 10 times their original value.
Swing and Day Trading reveals methods to time the market swings, including specific trading setups, but it covers the basics as well, such as setting up a home trading office and how much money you can make day trading.
734 kr
Läs direkt efter köp
Evolution of a Trader explores the four trading styles that people use when learning to trade or invest in the stock market. Often, beginners enter the stock market by:
Buying and holding onto a stock (value investing). That works well until the trend ends or a bear market begins. Then they try Position trading. This is the same as buy-and-hold, except the technique sells positions before a significant trend change occurs. Swing trading follows when traders increase their frequency of trading, trying to catch the short-term up and down swings. Finally, people try Day trading by completing their trades in a single day.This series provides comprehensive coverage of the four trading styles by offering numerous tips, sharing discoveries, and discussing specific trading setups to help you become a successful trader or investor as you journey through each style.
Trading Basics takes an in-depth look at money management, stops, support and resistance, and offers dozens of tips every trader should know.
Fundamental Analysis and Position Trading discusses when to sell a buy-and-hold position, uncovers which fundamentals work best, and uses them to find stocks that become 10-baggers—stocks that climb by 10 times their original value.
Swing and Day Trading reveals methods to time the market swings, including specific trading setups, but it covers the basics as well, such as setting up a home trading office and how much money you can make day trading.
734 kr
Läs direkt efter köp
Evolution of a Trader explores the four trading styles that people use when learning to trade or invest in the stock market. Often, beginners enter the stock market by:
Buying and holding onto a stock (value investing). That works well until the trend ends or a bear market begins. Then they try Position trading. This is the same as buy-and-hold, except the technique sells positions before a significant trend change occurs. Swing trading follows when traders increase their frequency of trading, trying to catch the short-term up and down swings. Finally, people try Day trading by completing their trades in a single day.This series provides comprehensive coverage of the four trading styles by offering numerous tips, sharing discoveries, and discussing specific trading setups to help you become a successful trader or investor as you journey through each style.
Trading Basics takes an in-depth look at money management, stops, support and resistance, and offers dozens of tips every trader should know.
Fundamental Analysis and Position Trading discusses when to sell a buy-and-hold position, uncovers which fundamentals work best, and uses them to find stocks that become 10-baggers—stocks that climb by 10 times their original value.
Swing and Day Trading reveals methods to time the market swings, including specific trading setups, but it covers the basics as well, such as setting up a home trading office and how much money you can make day trading.
257 kr
Läs direkt efter köp
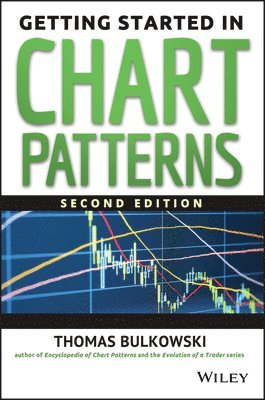
Chart pattern analysis is not only one of the most important investing tools, but also one of the most popular. Filled with expert insights and practical advice from one of the best in the business, Getting Started in Chart Patterns, Second Edition helps new and seasoned traders alike profit by tracking and identifying specific chart patterns.
Substantially revised and expanded, this new edition stay true to the original, with author Thomas Bulkowski''s frank discussion of how trading behavior can affect the bottom line. Interwoven throughout the technical presentations are fascinating anecdotes drawn from the author''s quarter-century as a professional trader that vividly demonstrate how one of the best in the business leverages the power of chart patterns.
Includes additional charts for ETFs and mutual funds Introduces more than 40 key chart formations, as well as trading tactics that can be used in conjunction with them Supplies actual trades, with their corresponding dollar amountsIf you''re looking to gain a better understanding of this discipline, look no further than the Second Edition of Getting Started in Chart Patterns.
213 kr
Skickas inom 5-8 vardagar
257 kr
Läs direkt efter köp
Chart pattern analysis is not only one of the most important investing tools, but also one of the most popular. Filled with expert insights and practical advice from one of the best in the business, Getting Started in Chart Patterns, Second Edition helps new and seasoned traders alike profit by tracking and identifying specific chart patterns.
Substantially revised and expanded, this new edition stay true to the original, with author Thomas Bulkowski''s frank discussion of how trading behavior can affect the bottom line. Interwoven throughout the technical presentations are fascinating anecdotes drawn from the author''s quarter-century as a professional trader that vividly demonstrate how one of the best in the business leverages the power of chart patterns.
Includes additional charts for ETFs and mutual funds Introduces more than 40 key chart formations, as well as trading tactics that can be used in conjunction with them Supplies actual trades, with their corresponding dollar amountsIf you''re looking to gain a better understanding of this discipline, look no further than the Second Edition of Getting Started in Chart Patterns.
496 kr
Skickas inom 5-8 vardagar
611 kr
Läs direkt efter köp
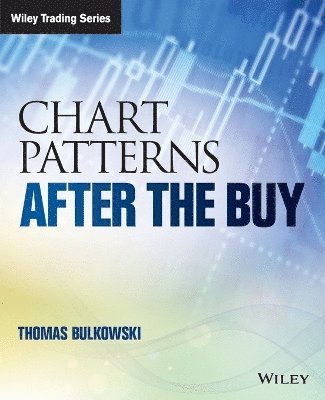
Chart Patterns: After the Buy goes beyond simple chart pattern identification to show what comes next. Author and stock trader Thomas Bulkowski is one of the industry''s most respected authorities in technical analysis; for this book, he examined over 43,000 chart patterns to discover what happens after you buy the stock. His findings are detailed here, to help you select better buy signals, avoid disaster, and make more money.
Bulkowski analyzed thousands of trades to identify common paths a stock takes after the breakout from a chart pattern. By combining those paths, he discovered the typical routes a stock takes, which he calls configurations. Match your chart to one of those configurations and you will know, before you buy, how your trade will likely perform. Now you can avoid potentially disastrous trades to focus on the big winners.
Each chapter illustrates the behavior of a specific pattern. Identification guidelines help even beginners recognize common patterns, and expert analysis sheds light on the period of the stock''s behavior that actually affects your investment. You''ll discover ideal buy and sell setups, how to set price targets, and more, with almost 370 charts and illustrations to guide you each step of the way. Coverage includes the most common and popular patterns, but also the lesser-known ones like bad earnings surprises, price mirrors, price mountains, and straight-line runs. Whether you''re new to chart patterns or an experienced professional, this book provides the insight you need to select better trades.
Identify chart patterns Select better buy signals Predict future behavior Learn the best stop locationsKnowing the pattern is one thing, but knowing how often a stop will trigger and how often you can expect a stock to reach its target price is another matter entirely—and it impacts your trade performance immensely. Chart Patterns: After the Buy is the essential reference guide to using chart patterns effectively throughout the entire life of the trade.
590 kr
Läs direkt efter köp
Chart Patterns: After the Buy goes beyond simple chart pattern identification to show what comes next. Author and stock trader Thomas Bulkowski is one of the industry''s most respected authorities in technical analysis; for this book, he examined over 43,000 chart patterns to discover what happens after you buy the stock. His findings are detailed here, to help you select better buy signals, avoid disaster, and make more money.
Bulkowski analyzed thousands of trades to identify common paths a stock takes after the breakout from a chart pattern. By combining those paths, he discovered the typical routes a stock takes, which he calls configurations. Match your chart to one of those configurations and you will know, before you buy, how your trade will likely perform. Now you can avoid potentially disastrous trades to focus on the big winners.
Each chapter illustrates the behavior of a specific pattern. Identification guidelines help even beginners recognize common patterns, and expert analysis sheds light on the period of the stock''s behavior that actually affects your investment. You''ll discover ideal buy and sell setups, how to set price targets, and more, with almost 370 charts and illustrations to guide you each step of the way. Coverage includes the most common and popular patterns, but also the lesser-known ones like bad earnings surprises, price mirrors, price mountains, and straight-line runs. Whether you''re new to chart patterns or an experienced professional, this book provides the insight you need to select better trades.
Identify chart patterns Select better buy signals Predict future behavior Learn the best stop locationsKnowing the pattern is one thing, but knowing how often a stop will trigger and how often you can expect a stock to reach its target price is another matter entirely—and it impacts your trade performance immensely. Chart Patterns: After the Buy is the essential reference guide to using chart patterns effectively throughout the entire life of the trade.
1 391 kr
Skickas inom 5-8 vardagar
1 497 kr
Läs direkt efter köp
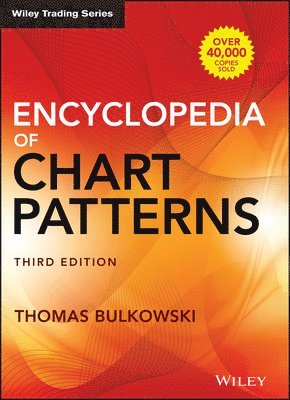
The market''s bestselling and most comprehensive reference on chart patterns, backed by statistics and decades of experience
When the smart money trades the securities markets, they leave behind financial footprints. Combine enough footprints together and you have a trail to follow. That trail becomes what’s called a chart pattern. Encyclopedia of Chart Patterns, Third Edition expands upon Bulkowski''s immensely popular Second Edition with fully revised and updated material on chart patterns. Whether you’re new to the stock market or an experienced professional trader, use this book as a reference guide to give you an edge.
Within the pages of this book, you’ll learn how to identify chart patterns, supported by easy-to-understand performance statistics describing how well a pattern works, what the failure rate is, and what special quirks suggest better future performance. You’ll discover how often a stop loss order will trigger at various locations within a chart pattern, how the chart pattern’s performance has evolved over the past three decades, and how to profit from failure by trading busted patterns.
This broadened and revised Third Edition offers investors the most comprehensive, up-to-date guide to this popular method of market analysis. Written by a leading expert on chart patterns, Tom Bulkowski, this edition includes revised statistics on 75 chart patterns including 23 new ones, with pictures and performance statistics, packaged within easy-to-read text.
Gain essential knowledge of chart patterns and how they are used to predict price movements in bull and bear markets New tables include how often stops are hit, busted pattern performance, performance over the decades, and special pattern features Joining Tour, Identification Guidelines, Focus on Failures, Statistics, Trading Tactics and Sample Trade is Experience. It puts you in the passenger’s seat so you can share lessons learned from Bulkowski''s trades This edition reports on statistics from nearly four times the number of samples used in the Second Edition and ten times the number in the First EditionThe Encyclopedia of Chart Patterns, Third Edition further solidifies the reputation of this book as the leading reference on chart patterns, setting it far above the competition.
1 597 kr
Läs direkt efter köp
The market''s bestselling and most comprehensive reference on chart patterns, backed by statistics and decades of experience
When the smart money trades the securities markets, they leave behind financial footprints. Combine enough footprints together and you have a trail to follow. That trail becomes what’s called a chart pattern. Encyclopedia of Chart Patterns, Third Edition expands upon Bulkowski''s immensely popular Second Edition with fully revised and updated material on chart patterns. Whether you’re new to the stock market or an experienced professional trader, use this book as a reference guide to give you an edge.
Within the pages of this book, you’ll learn how to identify chart patterns, supported by easy-to-understand performance statistics describing how well a pattern works, what the failure rate is, and what special quirks suggest better future performance. You’ll discover how often a stop loss order will trigger at various locations within a chart pattern, how the chart pattern’s performance has evolved over the past three decades, and how to profit from failure by trading busted patterns.
This broadened and revised Third Edition offers investors the most comprehensive, up-to-date guide to this popular method of market analysis. Written by a leading expert on chart patterns, Tom Bulkowski, this edition includes revised statistics on 75 chart patterns including 23 new ones, with pictures and performance statistics, packaged within easy-to-read text.
Gain essential knowledge of chart patterns and how they are used to predict price movements in bull and bear markets New tables include how often stops are hit, busted pattern performance, performance over the decades, and special pattern features Joining Tour, Identification Guidelines, Focus on Failures, Statistics, Trading Tactics and Sample Trade is Experience. It puts you in the passenger’s seat so you can share lessons learned from Bulkowski''s trades This edition reports on statistics from nearly four times the number of samples used in the Second Edition and ten times the number in the First EditionThe Encyclopedia of Chart Patterns, Third Edition further solidifies the reputation of this book as the leading reference on chart patterns, setting it far above the competition.
395 kr
Läs direkt efter köp
439 kr
Skickas inom 3-6 vardagar
703 kr
Skickas inom 3-6 vardagar