Övrigt, Engelska, 2016
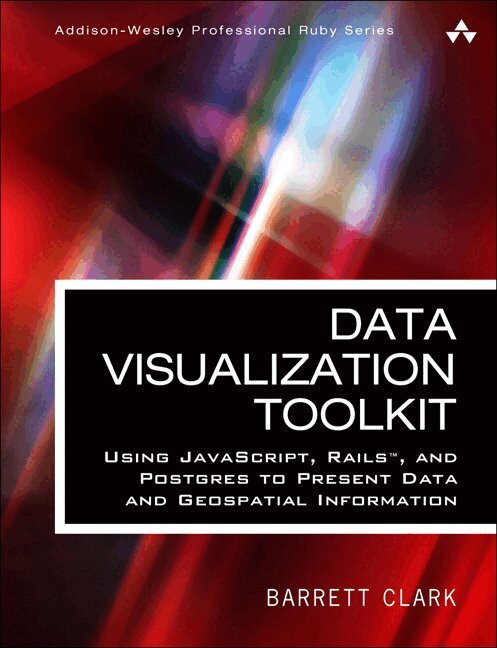
Data Visualization Toolkit
535 kr
Skickas torsdag 15/10. Fri frakt över 249 kr.
Beskrivning
Create Beautiful Visualizations that Free Your Data to Tell Powerful Truths
“The depth of Barrett Clark’s knowledge shines through in his writing: clear, concise, and confident. Barrett has been practicing all of this stuff in his day job for many years–Postgres, D3, GIS, all of it. The knowledge in this book is real-world and hard-earned!”
–From the Foreword by Obie Fernandez
Data Visualization Toolkit is your hands-on, practical, and holistic guide to the art of visualizing data. You’ll learn how to use Rails, jQuery, D3, Leaflet, PostgreSQL, and PostGIS together, creating beautiful visualizations and maps that give your data a voice and to make it “dance.”
Barrett Clark teaches through real-world problems and examples developed specifically to illuminate every technique you need to generate stunningly effective visualizations. You’ll move from the absolute basics toward deep dives, mastering diverse visualizations and discovering when to use each. Along the way, you’ll build three start-to-finish visualization applications, using actual real estate, weather, and travel datasets.
Clark addresses every component of data visualization: your data, database, application server, visualization libraries, and more. He explains data transformations; presents expert techniques in JavaScript, Ruby, and SQL; and illuminates key concepts associated with both descriptive statistics and geospatial data. Throughout, everything is aimed at one goal: to help you cut through the clutter and let your data tell all it can.
This guide will help you
- Explore and understand the data visualization technology stack
- Master the thought process and steps involved in importing data
- Extract, transform, and load data in usable, reliable form
- Handle spotty data, or data that doesn’t line up with what your chart expects
- Use D3 to build pie and bar charts, scatter and box plots, and more
- Work effectively with time-series data
- Tweak Ruby and SQL to optimize performance with large datasets
- Use raw SQL in Rails: window functions, subqueries, and common table expressions
- Build chord diagrams and time-series aggregates
- Use separate databases or schema for reporting databases
- Integrate geographical data via geospatial SQL queries
- Construct maps with Leaflet and Rails
- Query geospatial data the “Rails way” and the “raw SQL way”
Produktinformation
- Märke: Pearson Education
- Utgivningsdatum: 2016-08-04
- Vikt: 1 g
- Språk: Engelska
- Serie: Addison-Wesley Professional Ruby Series
- Antal sidor: 256
- Upplaga: 1
- Förlag: Pearson Education
- EAN: 9780134465241
Utforska kategorier
Betyg & recensioner
0 recensioner
Inga recensioner tillgängliga.