• Fri frakt över 249 kr
  • •
  • Snabba leveranser
  • •
  • Billiga böcker
Kundservice

Du är på sajten för privatpersoner.

Företag, bibliotek eller offentlig verksamhet?

Du handlar på classic.bokus.com, där alla dina funktioner finns intakta.
Till classic.bokus.com
Bokus logotyp. Gå till startsidan.
  • Erbjudanden
  • Nyheter
  • Student
  • Topplistor
  • Barn & ungdom
  • Bokus Play
  • E-böcker
  • Pocketböcker
  • Spel & pussel

10% rabatt på allt med kod NYSTART10 →

Sidfot

Mina sidor

    Hjälp

    • Kundservice
    • Vanliga frågor och svar
    • Frakt och leverans
    • Retur vid ångerrätt
    • Reklamera vara
    • Betalning
    • Köpvillkor
    • Allmänna villkor
    • Information om webbplatsens tillgänglighet

    Om Bokus

    • Om oss
    • Pressrum
    • För studenter
    • För företag
    • För bibliotek och offentlig verksamhet
    • För leverantörer
    • Hållbarhet

    Populärt

    • Aktuella erbjudanden
    • Presentkort
    • Studentlitteratur
    • Nya böcker
    • Topplistor
    • Signerade böcker
    • Engelska böcker

    Inspiration

    • Boktips
    • BookTok
    • Populära bokserier
    • Barnbokskaraktärer
    • Populära författare
    Logotyp för Bokus
    Följ oss på Facebook (extern länk)Följ oss på Instagram (extern länk)Följ oss på YouTube (extern länk)Följ oss på TikTok (extern länk)
    bokus @ CookiesAnpassa cookiesIntegritetspolicyKöpvillkor
    Till Citymail hemsida (extern länk)Till Budbee hemsida (extern länk)Till Postnord hemsida (extern länk)Till Schenker hemsida (extern länk)Till Early Bird hemsida (extern länk)Till Walleys hemsida (extern länk)
    1. Naturvetenskap och teknik
    2. Matematik och naturvetenskap
    3. Matematik

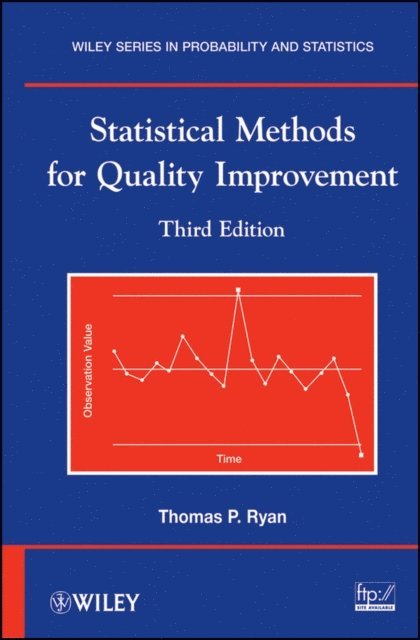
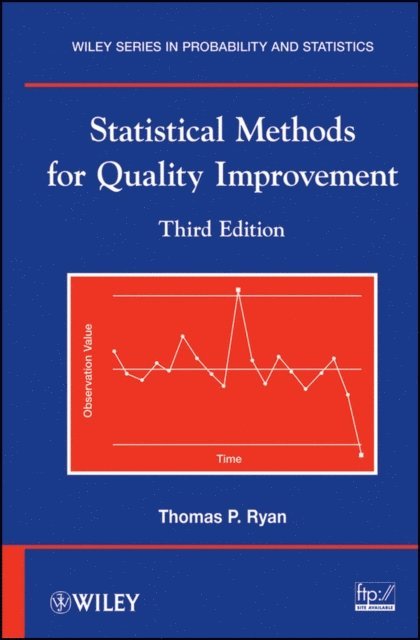
    Statistical Methods for Quality Improvement

    AvThomas P. Ryan

    Inbunden, Engelska, 2011

    Del i serien Wiley Series in Probability and Statistics

    1 639 kr

    Beställningsvara. Skickas inom 5-8 vardagar. Fri frakt över 249 kr.

    Fler format och utgåvor

    E-bok

    1 893 kr

    E-bok

    1 893 kr

    Beskrivning

    Praise for the Second Edition "As a comprehensive statistics reference book for quality improvement, it certainly is one of the best books available."—TechnometricsThis new edition continues to provide the most current, proven statistical methods for quality control and quality improvementThe use of quantitative methods offers numerous benefits in the fields of industry and business, both through identifying existing trouble spots and alerting management and technical personnel to potential problems. Statistical Methods for Quality Improvement, Third Edition guides readers through a broad range of tools and techniques that make it possible to quickly identify and resolve both current and potential trouble spots within almost any manufacturing or nonmanufacturing process. The book provides detailed coverage of the application of control charts, while also exploring critical topics such as regression, design of experiments, and Taguchi methods.In this new edition, the author continues to explain how to combine the many statistical methods explored in the book in order to optimize quality control and improvement. The book has been thoroughly revised and updated to reflect the latest research and practices in statistical methods and quality control, and new features include: Updated coverage of control charts, with newly added toolsThe latest research on the monitoring of linear profiles and other types of profilesSections on generalized likelihood ratio charts and the effects of parameter estimation on the properties of CUSUM and EWMA proceduresNew discussions on design of experiments that include conditional effects and fraction of design space plotsNew material on Lean Six Sigma and Six Sigma programs and trainingIncorporating the latest software applications, the author has added coverage on how to use Minitab software to obtain probability limits for attribute charts. new exercises have been added throughout the book, allowing readers to put the latest statistical methods into practice. Updated references are also provided, shedding light on the current literature and providing resources for further study of the topic.Statistical Methods for Quality Improvement, Third Edition is an excellent book for courses on quality control and design of experiments at the upper-undergraduate and graduate levels. the book also serves as a valuable reference for practicing statisticians, engineers, and physical scientists interested in statistical quality improvement.

    Produktinformation

    • Utgivningsdatum:2011-08-23
    • Mått:165 x 241 x 36 mm
    • Vikt:1 107 g
    • Format:Inbunden
    • Språk:Engelska
    • Serie:Wiley Series in Probability and Statistics
    • Antal sidor:704
    • Upplaga:3
    • Förlag:John Wiley & Sons Inc
    • ISBN:9780470590744

    Utforska kategorier

    • Matematik inom Naturvetenskap och teknik
    • Projektledning inom Ekonomi och Ledarskap

    Mer om författaren

    THOMAS P. RYAN, PhD, served on the Editorial Review Board of the Journal of Quality Technology from 1990–2006, including three years as the book review editor. He is an elected Fellow of the American Statistical Association, the American Society for Quality, and the Royal Statistical Society. A former consultant to Cytel Software Corporation, Dr. Ryan currently teaches advanced courses at statistics.com on the design of experiments, statistical process control, and engineering statistics. He is the author of Modern Experimental Design, Modern Regression Methods, Second Edition, and Modern Engineering Statistics, all published by Wiley.

    Recensioner i media

    "Ryan covers everything you could possibly imagine in a statistical methods book...Those with more advanced statistical experience will get the most from this book, although the reading level is suitable for the average user. This is an excellent reference for any of your quality improvement needs." (Quality Progress, July 2012)

    Innehållsförteckning

    • Preface xix Preface to the Second Edition xxiPreface to the First Edition xxiiiPART I FUNDAMENTAL QUALITY IMPROVEMENT AND STATISTICAL CONCEPTS1 Introduction 31.1 Quality and Productivity, 41.2 Quality Costs (or Does It?), 51.3 The Need for Statistical Methods, 51.4 Early Use of Statistical Methods for Improving Quality, 61.5 Influential Quality Experts, 71.6 Summary, 92 Basic Tools for Improving Quality 132.1 Histogram, 132.2 Pareto Charts, 172.3 Scatter Plots, 212.4 Control Chart, 242.5 Check Sheet, 262.6 Cause-and-Effect Diagram, 262.7 Defect Concentration Diagram, 282.8 The Seven Newer Tools, 282.9 Software, 302.10 Summary, 313 Basic Concepts in Statistics and Probability 333.1 Probability, 333.2 Sample Versus Population, 353.3 Location, 363.4 Variation, 383.5 Discrete Distributions, 413.6 Continuous Distributions, 553.7 Choice of Statistical Distribution, 693.8 Statistical Inference, 693.9 Enumerative Studies Versus Analytic Studies, 81PARTII CONTROL CHARTS AND PROCESS CAPABILITY4 Control Charts for Measurements With Subgrouping (for One Variable) 894.1 Basic Control Chart Principles, 894.2 Real-Time Control Charting Versus Analysis of Past Data, 924.3 Control Charts: When to Use, Where to Use, How Many to Use, 944.4 Benefits from the Use of Control Charts, 944.5 Rational Subgroups, 954.6 Basic Statistical Aspects of Control Charts, 954.7 Illustrative Example, 964.8 Illustrative Example with Real Data, 1144.9 Determining the Point of a Parameter Change, 1164.10 Acceptance Sampling and Acceptance Control Chart, 1174.11 Modified Limits, 1244.12 Difference Control Charts, 1244.13 Other Charts, 1264.14 Average Run Length (ARL), 1274.15 Determining the Subgroup Size, 1294.16 Out-of-Control Action Plans, 1314.17 Assumptions for the Charts in This Chapter, 1324.18 Measurement Error, 1404.19 Software, 1424.20 Summary, 1435 Control Charts for Measurements Without Subgrouping (for One Variable) 1575.2 Transform the Data or Fit a Distribution?, 1705.3 Moving Average Chart, 1715.4 Controlling Variability with Individual Observations, 1735.5 Summary, 1756 Control Charts for Attributes 1816.1 Charts for Nonconforming Units, 1826.2 Charts for Nonconformities, 2026.3 Summary, 2187 Process Capability 2257.1 Data Acquisition for Capability Indices, 2257.2 Process Capability Indices, 2277.3 Estimating the Parameters in Process Capability Indices, 2327.4 Distributional Assumption for Capability Indices, 2357.5 Confidence Intervals for Process Capability Indices, 2367.6 Asymmetric Bilateral Tolerances, 2437.7 Capability Indices That Are a Function of Percent Nonconforming, 2457.8 Modified k Index, 2507.9 Other Approaches, 2517.10 Process Capability Plots, 2517.11 Process Capability Indices Versus Process Performance Indices, 2527.12 Process Capability Indices with Autocorrelated Data, 2537.13 Software for Process Capability Indices, 2537.14 Summary, 2538 Alternatives to Shewhart Charts 2618.1 Introduction, 2618.2 Cumulative Sum Procedures: Principles and Historical Development, 2638.3 CUSUM Procedures for Controlling Process Variability, 2838.4 Applications of CUSUM Procedures, 2868.5 Generalized Likelihood Ratio Charts: Competitive Alternative to CUSUM Charts, 2868.6 CUSUM Procedures for Nonconforming Units, 2868.7 CUSUM Procedures for Nonconformity Data, 2908.8 Exponentially Weighted Moving Average Charts, 2948.9 Software, 3018.10 Summary, 3019 Multivariate Control Charts for Measurement and Attribute Data 3099.1 Hotelling's T2 Distribution, 3129.2 A T2 Control Chart, 3139.3 Multivariate Chart Versus Individual X-Charts, 3269.4 Charts for Detecting Variability and Correlation Shifts, 3279.5 Charts Constructed Using Individual Observations, 3309.6 When to Use Each Chart, 3359.7 Actual Alpha Levels for Multiple Points, 3369.8 Requisite Assumptions, 3369.9 Effects of Parameter Estimation on ARLs, 3379.10 Dimension-Reduction and Variable Selection Techniques, 3379.11 Multivariate CUSUM Charts, 3389.12 Multivariate EWMA Charts, 3399.13 Effect of Measurement Error, 3439.14 Applications of Multivariate Charts, 3449.15 Multivariate Process Capability Indices, 3449.16 Summary, 34410 Miscellaneous Control Chart Topics 35310.1 Pre-control, 35310.2 Short-Run SPC, 35610.3 Charts for Autocorrelated Data, 35910.4 Charts for Batch Processes, 36410.5 Charts for Multiple-Stream Processes, 36410.6 Nonparametric Control Charts, 36510.7 Bayesian Control Chart Methods, 36610.8 Control Charts for Variance Components, 36710.9 Control Charts for Highly Censored Data, 36710.10 Neural Networks, 36710.11 Economic Design of Control Charts, 36810.12 Charts with Variable Sample Size and/or Variable Sampling Interval, 37010.13 Users of Control Charts, 37110.14 Software for Control Charting, 374PART III BEYOND CONTROL CHARTS: GRAPHICAL AND STATISTICAL METHODS11 Graphical Methods 38711.1 Histogram, 38811.2 Stem-and-Leaf Display, 38911.3 Dot Diagrams, 39011.4 Boxplot, 39211.5 Normal Probability Plot, 39611.6 Plotting Three Variables, 39811.7 Displaying More Than Three Variables, 39911.8 Plots to Aid in Transforming Data, 39911.9 Summary, 40112 Linear Regression 40712.1 Simple Linear Regression, 40712.2 Worth of the Prediction Equation, 41112.3 Assumptions, 41312.4 Checking Assumptions Through Residual Plots, 41412.5 Confidence Intervals and Hypothesis Test, 41512.6 Prediction Interval for Y, 41612.7 Regression Control Chart, 41712.8 Cause-Selecting Control Charts, 41912.9 Linear, Nonlinear, and Nonparametric Profiles, 42112.10 Inverse Regression, 42312.11 Multiple Linear Regression, 42612.12 Issues in Multiple Regression, 42612.13 Software For Regression, 42912.14 Summary, 42913 Design of Experiments 43513.1 A Simple Example of Experimental Design Principles, 43513.2 Principles of Experimental Design, 43713.3 Statistical Concepts in Experimental Design, 43913.4 t-Tests, 44113.5 Analysis of Variance for One Factor, 44513.6 Regression Analysis of Data from Designed Experiments, 45513.7 ANOVA for Two Factors, 46013.8 The 23 Design, 46913.9 Assessment of Effects Without a Residual Term, 47413.10 Residual Plot, 47713.11 Separate Analyses Using Design Units and Uncoded Units, 47913.12 Two-Level Designs with More Than Three Factors, 48013.13 Three-Level Factorial Designs, 48213.14 Mixed Factorials, 48313.15 Fractional Factorials, 48313.16 Other Topics in Experimental Design and Their Applications, 49313.17 Summary, 50014 Contributions of Genichi Taguchi and Alternative Approaches 51314.1 "Taguchi Methods", 51314.2 Quality Engineering, 51414.3 Loss Functions, 51414.4 Distribution Not Centered at the Target, 51814.5 Loss Functions and Specification Limits, 51814.6 Asymmetric Loss Functions, 51814.7 Signal-to-Noise Ratios and Alternatives, 52214.8 Experimental Designs for Stage One, 52414.9 Taguchi Methods of Design, 52514.10 Determining Optimum Conditions, 55314.11 Summary, 55815 Evolutionary Operation 56515.1 EVOP Illustrations, 56615.2 Three Variables, 57615.3 Simplex EVOP, 57815.4 Other EVOP Procedures, 58115.5 Miscellaneous Uses of EVOP, 58115.6 Summary, 58216 Analysis of Means 58716.1 ANOM for One-Way Classifications, 58816.2 ANOM for Attribute Data, 59116.3 ANOM When Standards Are Given, 59416.4 ANOM for Factorial Designs, 59616.5 ANOM When at Least One Factor Has More Than Two Levels, 60116.6 Use of ANOM with Other Designs, 61016.7 Nonparametric ANOM, 61016.8 Summary, 61117 Using Combinations of Quality Improvement Tools 61517.1 Control Charts and Design of Experiments, 61617.2 Control Charts and Calibration Experiments, 61617.3 Six Sigma Programs, 61617.4 Statistical Process Control and Engineering Process Control, 624Answers to Selected Exercises 629Appendix: Statistical Tables 633Author Index 645Subject Index 657