• Fri frakt över 249 kr
  • •
  • Snabba leveranser
  • •
  • Billiga böcker
Kundservice

Du är på sajten för privatpersoner.

Företag, bibliotek eller offentlig verksamhet?

Du handlar på classic.bokus.com, där alla dina funktioner finns intakta.
Till classic.bokus.com
Bokus logotyp. Gå till startsidan.
  • Erbjudanden
  • Nyheter
  • Student
  • Topplistor
  • Barn & ungdom
  • Bokus Play
  • E-böcker
  • Pocketböcker
  • Spel & pussel

10% rabatt på allt med kod NYSTART10 →

Sidfot

Mina sidor

    Hjälp

    • Kundservice
    • Vanliga frågor och svar
    • Frakt och leverans
    • Retur vid ångerrätt
    • Reklamera vara
    • Betalning
    • Köpvillkor
    • Allmänna villkor
    • Information om webbplatsens tillgänglighet

    Om Bokus

    • Om oss
    • Pressrum
    • För studenter
    • För företag
    • För bibliotek och offentlig verksamhet
    • För leverantörer
    • Hållbarhet

    Populärt

    • Aktuella erbjudanden
    • Presentkort
    • Studentlitteratur
    • Nya böcker
    • Topplistor
    • Signerade böcker
    • Engelska böcker

    Inspiration

    • Boktips
    • BookTok
    • Populära bokserier
    • Barnbokskaraktärer
    • Populära författare
    Logotyp för Bokus
    Följ oss på Facebook (extern länk)Följ oss på Instagram (extern länk)Följ oss på YouTube (extern länk)Följ oss på TikTok (extern länk)
    bokus @ CookiesAnpassa cookiesIntegritetspolicyKöpvillkor
    Till Citymail hemsida (extern länk)Till Budbee hemsida (extern länk)Till Postnord hemsida (extern länk)Till Schenker hemsida (extern länk)Till Early Bird hemsida (extern länk)Till Walleys hemsida (extern länk)
    1. Samhälle och politik
    2. Samhälle och kultur
    3. Kultur och medier
    4. Referensverk och tvärvetenskap

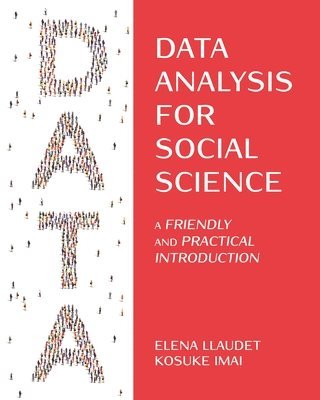
    Data Analysis for Social Science

    A Friendly and Practical Introduction

    AvElena Llaudet,Kosuke Imai

    Häftad, Engelska, 2022

    414 kr

    Beställningsvara. Skickas inom 5-8 vardagar. Fri frakt över 249 kr.

    Fler format och utgåvor

    Inbunden

    1 081 kr

    Beskrivning

    An ideal textbook for complete beginners—teaches from scratch R, statistics, and the fundamentals of quantitative social scienceData Analysis for Social Science provides a friendly introduction to the statistical concepts and programming skills needed to conduct and evaluate social scientific studies. Assuming no prior knowledge of statistics and coding and only minimal knowledge of math, the book teaches the fundamentals of survey research, predictive models, and causal inference while analyzing data from published studies with the statistical program R. It teaches not only how to perform the data analyses but also how to interpret the results and identify the analyses’ strengths and limitations.Progresses by teaching how to solve one kind of problem after another, bringing in methods as needed. It teaches, in this order, how to (1) estimate causal effects with randomized experiments, (2) visualize and summarize data, (3) infer population characteristics, (4) predict outcomes, (5) estimate causal effects with observational data, and (6) generalize from sample to population.Flips the script of traditional statistics textbooks. It starts by estimating causal effects with randomized experiments and postpones any discussion of probability and statistical inference until the final chapters. This unconventional order engages students by demonstrating from the very beginning how data analysis can be used to answer interesting questions, while reserving more abstract, complex concepts for later chapters.Provides a step-by-step guide to analyzing real-world data using the powerful, open-source statistical program R, which is free for everyone to use. The datasets are provided on the book’s website so that readers can learn how to analyze data by following along with the exercises in the book on their own computer.Assumes no prior knowledge of statistics or coding.Specifically designed to accommodate students with a variety of math backgrounds. It includes supplemental materials for students with minimal knowledge of math and clearly identifies sections with more advanced material so that readers can skip them if they so choose.Provides cheatsheets of statistical concepts and R code.Comes with instructor materials (upon request), including sample syllabi, lecture slides, and additional replication-style exercises with solutions and with the real-world datasets analyzed.Looking for a more advanced introduction? Consider Quantitative Social Science by Kosuke Imai. In addition to covering the material in Data Analysis for Social Science, it teaches diffs-in-diffs models, heterogeneous effects, text analysis, and regression discontinuity designs, among other things.

    Produktinformation

    • Utgivningsdatum:2022-11-29
    • Mått:203 x 254 x 18 mm
    • Vikt:612 g
    • Format:Häftad
    • Språk:Engelska
    • Antal sidor:256
    • Förlag:Princeton University Press
    • ISBN:9780691199436

    Utforska kategorier

    • Referensverk och tvärvetenskap inom Samhälle och politik
    • Sociologi inom Samhälle och politik

    Mer om författaren

    Elena Llaudet is Associate Professor of Political Science at Suffolk University in Boston. Kosuke Imai is Professor of Government and of Statistics at Harvard University.

    Innehållsförteckning

    • Preface1 Introduction1.1 Book Overview1.2 Chapter Summaries1.3 How to Use This Book1.4 Why Learn to Analyze Data?1.4.1 Learning to Code1.5 Getting Ready1.6 Introduction to R1.6.1 Doing Calculations in R1.6.2 Creating Objects in R1.6.3 Using Functions in R1.7 Loading and Making Sense of Data1.7.1 Setting the Working Directory1.7.2 Loading the Dataset1.7.3 Understanding the Data1.7.4 Identifying the Types of Variables Included1.7.5 Identifying the Number of Observations1.8 Computing and Interpreting Means1.8.1 Accessing Variables inside Dataframes1.8.2 Means1.9 Summary1.10 Cheatsheets1.10.1 Concepts and Notation1.10.2 R Symbols and Operators1.10.3 R Functions2 Estimating Causal Effects with Randomized Experiments2.1 Project STAR2.2 Treatment and Outcome Variables2.2.1 Treatment Variables2.2.2 Outcome Variables2.3 Individual Causal Effects2.4 Average Causal Effects2.4.1 Randomized Experiments and the Difference-in-Means Estimator2.5 Do Small Classes Improve Student Performance?2.5.1 Relational Operators in R2.5.2 Creating New Variables2.5.3 Subsetting Variables2.6 Summary2.7 Cheatsheets2.7.1 Concepts and Notation2.7.2 R Symbols and Operators2.7.3 R Functions3 Inferring Population Characteristics via Survey Research3.1 The EU Referendum in the UK3.2 Survey Research3.2.1 Random Sampling3.2.2 Potential Challenges3.3 Measuring Support for Brexit3.3.1 Predicting the Referendum Outcome3.3.2 Frequency Tables3.3.3 Tables of Proportions3.4 Who Supported Brexit?3.4.1 Handling Missing Data3.4.2 Two-Way Frequency Tables3.4.3 Two-Way Tables of Proportions3.4.4 Histograms3.4.5 Density Histograms3.4.6 Descriptive Statistics3.5 Relationship between Education and the LeaveVote in the Entire UK3.5.1 Scatter Plots3.5.2 Correlation3.6 Summary3.7 Cheatsheets3.7.1 Concepts and Notation3.7.2 R Symbols and Operators3.7.3 R Functions4 Predicting Outcomes Using Linear Regression4.1 GDP and Night-Time Light Emissions4.2 Predictors, Observed vs. Predicted Outcomes, andPrediction Errors4.3 Summarizing the Relationship between Two Variables with a Line4.3.1 The Linear Regression Model4.3.2 The Intercept Coefficient4.3.3 The Slope Coefficient4.3.4 The Least Squares Method4.4 Predicting GDP Using Prior GDP4.4.1 Relationship between GDP and Prior GDP4.4.2 With Natural Logarithm Transformations4.5 Predicting GDP Growth Using Night-Time LightEmissions4.6 Measuring How Well the Model Fits the Data with the Coefficient of Determination, R24.6.1 How Well Do the Three Predictive Modelsin This Chapter Fit the Data?4.7 Summary4.8 Appendix: Interpretation of the Slope in the Log-Log Linear Model4.9 Cheatsheets4.9.1 Concepts and Notation4.9.2 R Functions5 Estimating Causal Effects with Observational Data5.1 Russian State-Controlled TV Coverage of 2014Ukrainian Affairs5.2 Challenges of Estimating Causal Effects withObservational Data5.2.1 Confounding Variables5.2.2 Why Are Confounders a Problem?5.2.3 Confounders in Randomized Experiments5.3 The Effect of Russian TV on Ukrainians’ VotingBehavior5.3.1 Using the Simple Linear Model to Computethe Difference-in-Means Estimator5.3.2 Controlling for Confounders Using aMultiple Linear Regression Model5.4 The Effect of Russian TV on Ukrainian ElectoralOutcomes5.4.1 Using the Simple Linear Model to Computethe Difference-in-Means Estimator5.4.2 Controlling for Confounders Using aMultiple Linear Regression Model5.5 Internal and External Validity5.5.1 Randomized Experiments vs.Observational Studies5.5.2 The Role of Randomization5.5.3 How Good Are the Two Causal Analysesin This Chapter?5.5.4 How Good Was the Causal Analysis inChapter 2?5.5.5 The Coefficient of Determination, R25.6 Summary5.7 Cheatsheets5.7.1 Concepts and Notation5.7.2 R Functions6 Probability6.1 What Is Probability?6.2 Axioms of Probability6.3 Events, Random Variables, and ProbabilityDistributions6.4 Probability Distributions6.4.1 The Bernoulli Distribution6.4.2 The Normal Distribution6.4.3 The Standard Normal Distribution6.4.4 Recap6.5 Population Parameters vs. Sample Statistics6.5.1 The Law of Large Numbers6.5.2 The Central Limit Theorem6.5.3 Sampling Distribution of the Sample Mean6.6 Summary6.7 Appendix: For Loops6.8 Cheatsheets6.8.1 Concepts and Notation6.8.2 R Symbols and Operators6.8.3 R Functions7 Quantifying Uncertainty7.1 Estimators and Their Sampling Distributions7.2 Confidence Intervals7.2.1 For the Sample Mean7.2.2 For the Difference-in-Means Estimator7.2.3 For Predicted Outcomes7.3 Hypothesis Testing7.3.1 With the Difference-in-Means Estimator7.3.2 With Estimated Regression Coefficients7.4 Statistical vs. Scientific Significance7.5 Summary7.6 Cheatsheets7.6.1 Concepts and Notation7.6.2 R Symbols and Operators7.6.3 R FunctionsIndex of ConceptsIndex of Mathematical NotationIndex of R and RStudio