• Fri frakt över 249 kr
  • •
  • Snabba leveranser
  • •
  • Billiga böcker
Kundservice

Du är på sajten för privatpersoner.

Företag, bibliotek eller offentlig verksamhet?

Du handlar på classic.bokus.com, där alla dina funktioner finns intakta.
Till classic.bokus.com
Bokus logotyp. Gå till startsidan.
  • Erbjudanden
  • Nyheter
  • Student
  • Topplistor
  • Barn & ungdom
  • Bokus Play
  • E-böcker
  • Pocketböcker
  • Spel & pussel

10% rabatt på allt med kod: NYSTART10 →

Sidfot

Mina sidor

    Hjälp

    • Kundservice
    • Vanliga frågor och svar
    • Frakt och leverans
    • Retur vid ångerrätt
    • Reklamera vara
    • Betalning
    • Köpvillkor
    • Allmänna villkor
    • Information om webbplatsens tillgänglighet

    Om Bokus

    • Om oss
    • Pressrum
    • För studenter
    • För företag
    • För bibliotek och offentlig verksamhet
    • För leverantörer
    • Hållbarhet

    Populärt

    • Aktuella erbjudanden
    • Presentkort
    • Studentlitteratur
    • Nya böcker
    • Topplistor
    • Signerade böcker
    • Engelska böcker

    Inspiration

    • Boktips
    • BookTok
    • Populära bokserier
    • Barnbokskaraktärer
    • Populära författare
    Logotyp för Bokus
    Följ oss på Facebook (extern länk)Följ oss på Instagram (extern länk)Följ oss på YouTube (extern länk)Följ oss på TikTok (extern länk)
    bokus @ CookiesAnpassa cookiesIntegritetspolicyKöpvillkor
    Till Citymail hemsida (extern länk)Till Budbee hemsida (extern länk)Till Postnord hemsida (extern länk)Till Schenker hemsida (extern länk)Till Early Bird hemsida (extern länk)Till Walleys hemsida (extern länk)
    1. Samhälle och politik
    2. Samhälle och kultur
    3. Kultur och medier
    4. Referensverk och tvärvetenskap

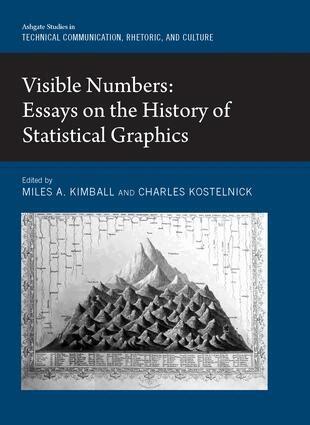
    Visible Numbers

    Essays on the History of Statistical Graphics

    AvMiles A. Kimball,Charles Kostelnick

    Inbunden, Engelska, 2015

    Del i serien Routledge Studies in Technical Communication, Rhetoric, and Culture

    2 421 kr

    Beställningsvara. Skickas inom 10-15 vardagar. Fri frakt över 249 kr.

    Beskrivning

    Bringing together scholars from around the world, this collection examines many of the historical developments in making data visible through charts, graphs, thematic maps, and now interactive displays. Today, we are used to seeing data portrayed in a dizzying array of graphic forms. Virtually any quantified knowledge, from social and physical science to engineering and medicine, as well as business, government, or personal activity, has been visualized. Yet the methods of making data visible are relatively new innovations, most stemming from eighteenth- and nineteenth-century innovations that arose as a logical response to a growing desire to quantify everything-from science, economics, and industry to population, health, and crime. Innovators such as Playfair, Alexander von Humboldt, Heinrich Berghaus, John Snow, Florence Nightingale, Francis Galton, and Charles Minard began to develop graphical methods to make data and their relations more visible. In the twentieth century, data design became both increasingly specialized within new and existing disciplines-science, engineering, social science, and medicine-and at the same time became further democratized, with new forms that make statistical, business, and government data more accessible to the public. At the close of the twentieth century and the beginning of the twenty-first, an explosion in interactive digital data design has exponentially increased our access to data. The contributors analyze this fascinating history through a variety of critical approaches, including visual rhetoric, visual culture, genre theory, and fully contextualized historical scholarship.

    Produktinformation

    • Utgivningsdatum:2015-12-15
    • Mått:156 x 234 x 27 mm
    • Vikt:748 g
    • Format:Inbunden
    • Språk:Engelska
    • Serie:Routledge Studies in Technical Communication, Rhetoric, and Culture
    • Antal sidor:330
    • Förlag:Taylor & Francis Ltd
    • ISBN:9781409448754

    Utforska kategorier

    • Referensverk och tvärvetenskap inom Samhälle och politik
    • Matematikens historia inom Naturvetenskap och teknik

    Mer om författaren

    Miles A. Kimball is Professor and Department Head of Communication and Rhetoric at Rensselaer Polytechnic Institute, USACharles Kostelnick is Professor of English at Iowa State University, USA.

    Recensioner i media

    "The present volume is a collection of ten essays on the subject, mainly written by humanities (especially English) professors. Given this fact, the focus is, as one might expect, on rhetoric and epistemology. (...) those individuals finding the perspective on the subject more in line with their own will be pleased by the 25-page annotated bibliography that is supplied, in addition to the 24 pages of cited works. Summing Up: Recommended."- C. Bauer, York College of Pennsylvania in CHOICE

    Innehållsförteckning

    • Introduction (Charles Kostelnick and Miles A. Kimball)Part 1 Visualizing Bodies: Health, Disease, EvolutionThe shape of things to come: geometric morphometrics, growth, and evolution (Alan Gross)Florence Nightingale's statistical tables for medical care (Lee Brasseur)Visualizing public health: smallpox epidemics, communicating risk, and changing representations of disease rates (Candice A. Welhausen and Rebecca E. Burnett)Part 2 Visualizing Nations: Moral Statistics, War, NationalismMoral statistics and the thematic maps of Joseph Fletcher (Robert Cook and Howard Wainer)Innovation and inertia in statistical mapping in 19th- and 20th-century America (Mark Monmonier)Mountains of wealth, rivers of commerce: Michael G. Mulhall's graphics and the imperial gaze (Miles A. Kimball)'A scheme of cross-roads, orderly and mad': British trench maps of World War I (Marguerite Helmers)Part 3 Examining Visible Numbers: Forms, Methods, HistoriographiesMosaics, culture, and rhetorical resiliency: the convoluted genealogy of a data display genre (Charles Kostelnick)The 20th century computer graphics revolution in statistics (Dianne Cook)The milestones project: a database for the history of data visualization (Michael Friendly, Matthew Sigal, and Derek Harnanansingh)Annotated bibliography of scholarship on the history of data graphics (Kevin Van Winkle)