• Fri frakt över 249 kr
  • •
  • Snabba leveranser
  • •
  • Billiga böcker
Kundservice

Du är på sajten för privatpersoner.

Företag, bibliotek eller offentlig verksamhet?

Du handlar på classic.bokus.com, där alla dina funktioner finns intakta.
Till classic.bokus.com
Bokus logotyp. Gå till startsidan.
  • Erbjudanden
  • Student
  • Topplistor
  • Barn & ungdom
  • Bokus Play
  • E-böcker
  • Ljudböcker
  • Pocketböcker
  • Spel och pussel

Pocketfynda! Hundratals böcker för 49 kr/st →

Sidfot

Mina sidor

    Hjälp

    • Kundservice
    • Vanliga frågor och svar
    • Frakt och leverans
    • Retur vid ångerrätt
    • Reklamera vara
    • Betalning
    • Köpvillkor
    • Allmänna villkor
    • Information om webbplatsens tillgänglighet

    Om Bokus

    • Om oss
    • Pressrum
    • För studenter
    • För företag
    • För bibliotek och offentlig verksamhet
    • För leverantörer
    • Hållbarhet

    Populärt

    • Aktuella erbjudanden
    • Presentkort
    • Studentlitteratur
    • Nya böcker
    • Topplistor
    • Signerade böcker
    • Engelska böcker

    Inspiration

    • Boktips
    • BookTok
    • Barnbokskaraktärer
    • Populära författare
    Logotyp för Bokus
    Följ oss på Facebook (extern länk)Följ oss på Instagram (extern länk)Följ oss på YouTube (extern länk)Följ oss på TikTok (extern länk)
    bokus @ CookiesAnpassa cookiesIntegritetspolicyKöpvillkor
    Till Citymail hemsida (extern länk)Till Budbee hemsida (extern länk)Till Postnord hemsida (extern länk)Till Schenker hemsida (extern länk)Till Early Bird hemsida (extern länk)Till Walleys hemsida (extern länk)
    1. Data och IT
    2. Affärsapplikationer

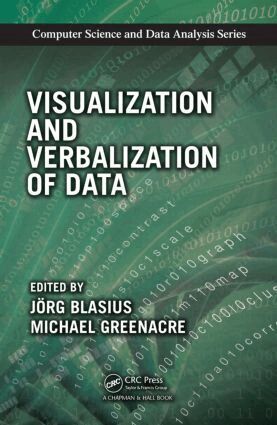
    Visualization and Verbalization of Data

    AvJorg Blasius,Michael Greenacre

    Inbunden, Engelska, 2014

    Del i serien Chapman & Hall/CRC Computer Science & Data Analysis

    2 481 kr

    Beställningsvara. Skickas inom 10-15 vardagar. Fri frakt över 249 kr.

    Beskrivning

    Visualization and Verbalization of Data shows how correspondence analysis and related techniques enable the display of data in graphical form, which results in the verbalization of the structures in data. Renowned researchers in the field trace the history of these techniques and cover their current applications.The first part of the book explains the historical origins of correspondence analysis and associated methods. The second part concentrates on the contributions made by the school of Jean-Paul Benzécri and related movements, such as social space and geometric data analysis. Although these topics are viewed from a French perspective, the book makes them understandable to an international audience.Throughout the text, well-known experts illustrate the use of the methods in practice. Examples include the spatial visualization of multivariate data, cluster analysis in computer science, the transformation of a textual data set into numerical data, the use of quantitative and qualitative variables in multiple factor analysis, different possibilities of recoding data prior to visualization, and the application of duality diagram theory to the analysis of a contingency table.

    Produktinformation

    • Utgivningsdatum:2014-04-10
    • Mått:156 x 234 x 27 mm
    • Vikt:890 g
    • Format:Inbunden
    • Språk:Engelska
    • Serie:Chapman & Hall/CRC Computer Science & Data Analysis
    • Antal sidor:392
    • Förlag:Taylor & Francis Inc
    • ISBN:9781466589803

    Utforska kategorier

    • Affärsapplikationer inom Data och IT
    • Webbdesign inom Data och IT
    • Databaser inom Data och IT

    Mer om författaren

    Jorg Blasius, Michael Greenacre

    Recensioner i media

    "This book presents a set of techniques for data analysis, together with the history of how these methods were developed. The audience seems to be those who are interested in these techniques, or, invested already in them, are curious about the history and intellectual process that led to their development… VAVOD [Visualization and Verbalization of Data] is a worthwhile read. Many of the chapters can be used as stand-alone introductions to particular techniques, including both theory and applications; as a collection, they offer a somewhat uneven but wide ranging and far reaching overview of a vibrant field of intellectual activity. The fact that many of the chapters are written by founders of the field, writing about techniques they created, refined and developed over decades, lends this book unusual gravitas as both a work of reference and as a document."—Omar De la Cruz Cabrera, Kent State University, in The American Statistician, August 2016"Given the continuing digitization of all facets of modern societies, we are fed with rapidly growing masses of data. At this pace, visualization is one decisive step to go beyond the factual knowledge of distributions to the recognition of conceptual spaces by advanced analytic methods. The big challenge will continue to be the verbalization of what we see as results of the analyses. This book lays the ground for significant advances on the way forward."—From the Foreword by Ekkehard Mochmann, Cologne

    Innehållsförteckning

    • History of Correspondence Analysis and Related Methods: Some Prehistory of CARME: Visual Language and Visual Thinking. Some History of Algebraic Canonical Forms and Data Analysis. Historical Elements of Correspondence Analysis and Multiple Correspondence Analysis. History of Nonlinear Principal Component Analysis. History of Canonical Correspondence Analysis. History of Multiway Component Analysis and Three-Way Correspondence Analysis. Past, Present, and Future of Multidimensional Scaling. History of Cluster Analysis. The Contribution of Benzécri and the French School: Simple Correspondence Analysis. Distributional Equivalence and Linguistics. Multiple Correspondence Analysis. Structured Data Analysis. Empirical Construction of Bourdieu’s Social Space. Multiple Factor Analysis: General Presentation and Comparison with Statis. Data Doubling and Fuzzy Coding. Symbolic Data Analysis: A Factorial Approach Based on Fuzzy Coded Data. Group Average Linkage Compared to Ward’s Method in Hierarchical Clustering. Analyzing a Pair of Tables: Co-Inertia Analysis and Duality Diagrams. References.