• Fri frakt över 249 kr
  • •
  • Snabba leveranser
  • •
  • Billiga böcker
Kundservice

Du är på sajten för privatpersoner.

Företag, bibliotek eller offentlig verksamhet?

Du handlar på classic.bokus.com, där alla dina funktioner finns intakta.
Till classic.bokus.com
Bokus logotyp. Gå till startsidan.
  • Erbjudanden
  • Student
  • Topplistor
  • Barn & ungdom
  • Bokus Play
  • E-böcker
  • Ljudböcker
  • Pocketböcker
  • Spel och pussel

Pocketfynda! Hundratals böcker för 49 kr/st →

Sidfot

Mina sidor

    Hjälp

    • Kundservice
    • Vanliga frågor och svar
    • Frakt och leverans
    • Retur vid ångerrätt
    • Reklamera vara
    • Betalning
    • Köpvillkor
    • Allmänna villkor
    • Information om webbplatsens tillgänglighet

    Om Bokus

    • Om oss
    • Pressrum
    • För studenter
    • För företag
    • För bibliotek och offentlig verksamhet
    • För leverantörer
    • Hållbarhet

    Populärt

    • Aktuella erbjudanden
    • Presentkort
    • Studentlitteratur
    • Nya böcker
    • Topplistor
    • Signerade böcker
    • Engelska böcker

    Inspiration

    • Boktips
    • BookTok
    • Barnbokskaraktärer
    • Populära författare
    Logotyp för Bokus
    Följ oss på Facebook (extern länk)Följ oss på Instagram (extern länk)Följ oss på YouTube (extern länk)Följ oss på TikTok (extern länk)
    bokus @ CookiesAnpassa cookiesIntegritetspolicyKöpvillkor
    Till Citymail hemsida (extern länk)Till Budbee hemsida (extern länk)Till Postnord hemsida (extern länk)Till Schenker hemsida (extern länk)Till Early Bird hemsida (extern länk)Till Walleys hemsida (extern länk)
    1. Naturvetenskap och teknik
    2. Matematik och naturvetenskap
    3. Matematik
    4. Matematisk statistik

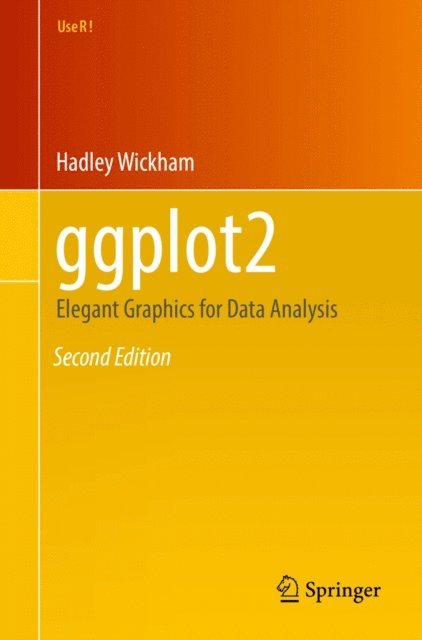
    ggplot2

    Elegant Graphics for Data Analysis

    AvHadley Wickham

    E-bok
    PDF, Engelska, 2016

    868 kr

    Läs direkt i Bokus Reader – eller ladda ned till din enhet (PDF kräver ofta zoom och scroll på små skärmar).

    Fler format och utgåvor

    E-bok

    837 kr

    Häftad

    616 kr

    Beskrivning

    This new edition to the classic book by ggplot2 creator Hadley Wickham highlights compatibility with knitr and RStudio. ggplot2 is a data visualization package for R that helps users create data graphics, including those that are multi-layered, with ease. With ggplot2, it''s easy to: 

    • produce handsome, publication-quality plots with automatic legends created from the plot specification
    • superimpose multiple layers (points, lines, maps, tiles, box plots) from different data sources with automatically adjusted common scales
    • add customizable smoothers that use powerful modeling capabilities of R, such as loess, linear models, generalized additive models, and robust regression
    • save any ggplot2 plot (or part thereof) for later modification or reuse
    • create custom themes that capture in-house or journal style requirements and that can easily be applied to multiple plots
    • approach a graph from a visual perspective, thinking about how eachcomponent of the data is represented on the final plot

    This book will be useful to everyone who has struggled with displaying data in an informative and attractive way. Some basic knowledge of R is necessary (e.g., importing data into R).  ggplot2 is a mini-language specifically tailored for producing graphics, and you''ll learn everything you need in the book. After reading this book you''ll be able to produce graphics customized precisely for your problems, and you''ll find it easy to get graphics out of your head and on to the screen or page.

    Produktinformation

    • Utgivningsdatum:2016-06-08
    • Språk:Engelska
    • Filformat:PDF
    • Kopieringsskydd:LCP
    • ISBN:9783319242774
    • Förlag:Springer International Publishing

    Utforska kategorier

    • Matematisk statistik inom Naturvetenskap och teknik
    • Affärsapplikationer inom Data och IT
    • Programmeringsböcker inom Data och IT