• Fri frakt över 249 kr
  • •
  • Snabba leveranser
  • •
  • Billiga böcker
Kundservice

Du är på sajten för privatpersoner.

Företag, bibliotek eller offentlig verksamhet?

Du handlar på classic.bokus.com, där alla dina funktioner finns intakta.
Till classic.bokus.com
Bokus logotyp. Gå till startsidan.
  • Erbjudanden
  • Nyheter
  • Student
  • Topplistor
  • Barn & ungdom
  • Bokus Play
  • E-böcker
  • Pocketböcker
  • Spel & pussel

10% rabatt på allt med kod NYSTART10 →

Sidfot

Mina sidor

    Hjälp

    • Kundservice
    • Vanliga frågor och svar
    • Frakt och leverans
    • Retur vid ångerrätt
    • Reklamera vara
    • Betalning
    • Köpvillkor
    • Allmänna villkor
    • Information om webbplatsens tillgänglighet

    Om Bokus

    • Om oss
    • Pressrum
    • För studenter
    • För företag
    • För bibliotek och offentlig verksamhet
    • För leverantörer
    • Hållbarhet

    Populärt

    • Aktuella erbjudanden
    • Presentkort
    • Studentlitteratur
    • Nya böcker
    • Topplistor
    • Signerade böcker
    • Engelska böcker

    Inspiration

    • Boktips
    • BookTok
    • Populära bokserier
    • Barnbokskaraktärer
    • Populära författare
    Logotyp för Bokus
    Följ oss på Facebook (extern länk)Följ oss på Instagram (extern länk)Följ oss på YouTube (extern länk)Följ oss på TikTok (extern länk)
    bokus @ CookiesAnpassa cookiesIntegritetspolicyKöpvillkor
    Till Citymail hemsida (extern länk)Till Budbee hemsida (extern länk)Till Postnord hemsida (extern länk)Till Schenker hemsida (extern länk)Till Early Bird hemsida (extern länk)Till Walleys hemsida (extern länk)
    1. Samhälle och politik
    2. Sociologi och antropologi
    3. Sociologi

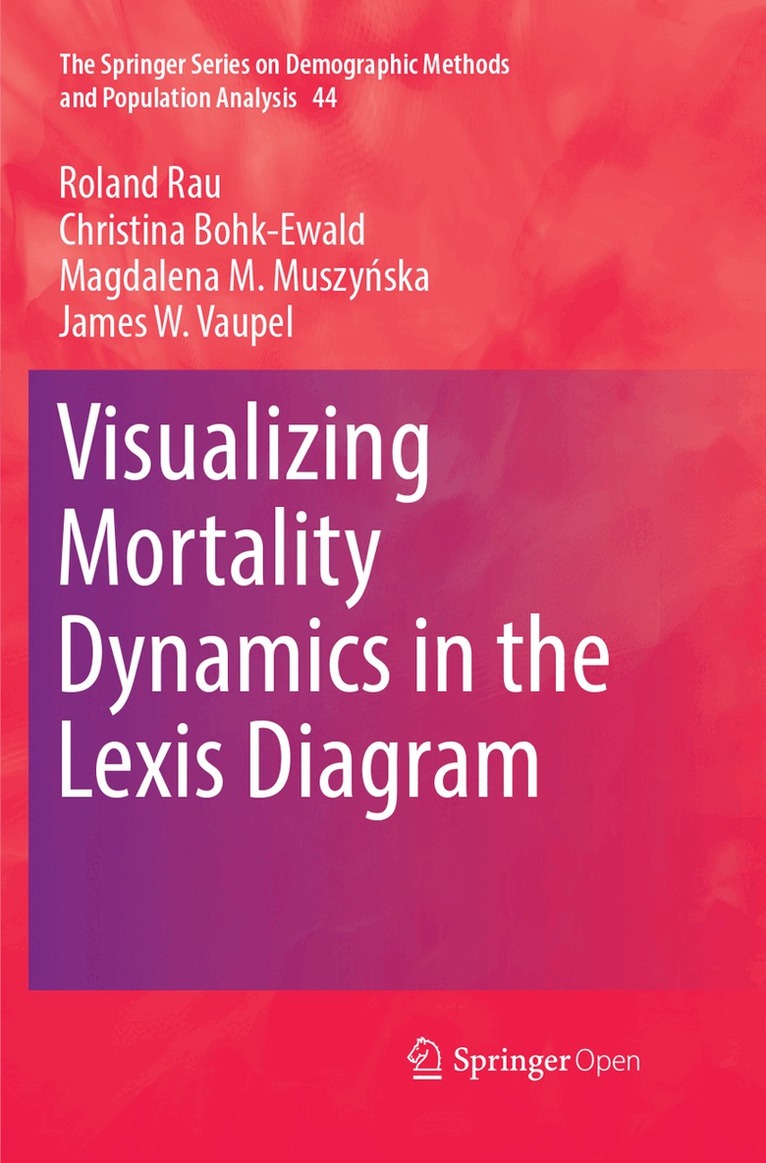
    Visualizing Mortality Dynamics in the Lexis Diagram

    AvRoland Rau,Christina Bohk-Ewald

    Häftad, Engelska, 2018

    Del 44 i serien Springer Series on Demographic Methods and Population Analysis

    562 kr

    Beställningsvara. Skickas inom 10-15 vardagar. Fri frakt över 249 kr.

    Fler format och utgåvor

    Inbunden

    562 kr

    Beskrivning

    This book visualizes mortality dynamics in the Lexis diagram. While the standard approach of plotting death rates is also covered, the focus in this book is on the depiction of rates of mortality improvement over age and time. This rather novel approach offers a more intuitive understanding of the underlying dynamics, enabling readers to better understand whether period- or cohort-effects were instrumental for the development of mortality in a particular country. Besides maps for single countries, the book includes maps on the dynamics of selected causes of death in the United States, such as cardiovascular diseases or lung cancer. The book also features maps for age-specific contributions to the change in life expectancy, for cancer survival and for seasonality in mortality for selected causes of death in the United States. The book is accompanied by instructions on how to use the freely available R Software to produce these types of surface maps. Readers are encouraged to use the presented tools to visualize other demographic data or any event that can be measured by age and calendar time, allowing them to adapt the methods to their respective research interests. The intended audience is anyone who is interested in visualizing data by age and calendar time; no specialist knowledge is required.This book is open access under a CC BY license.

    Produktinformation

    • Utgivningsdatum:2018-09-09
    • Mått:155 x 235 x 11 mm
    • Vikt:289 g
    • Format:Häftad
    • Språk:Engelska
    • Serie:Springer Series on Demographic Methods and Population Analysis
    • Antal sidor:169
    • Förlag:Springer International Publishing AG
    • ISBN:9783319878805

    Utforska kategorier

    • Sociologi inom Samhälle och politik
    • Samhällsmedicin och preventiv medicin inom Medicin

    Innehållsförteckning

    • 1: Introduction: Why do we visualize data and what is this book about?.- 2: The Lexis Diagram.- 3: Data and Software.- 4: Surface Plots of Observed Death Rates.- 5: Surface Plots of Smoothed Mortality Data.- 6: Surface Plots of Rates of Mortality Improvement.- 7: Surface Plots for Causes of Death.- 8: Surface Plots of Age-specific Contributions to the Increase in Life Expectancy.- 9: Seasonality of Causes of Death.- 10: Surface Plots for Cancer Survival.- 11: Summary and Outlook.- Bibliography.- References.- Additional Figures.