• Fri frakt över 249 kr
  • •
  • Snabba leveranser
  • •
  • Billiga böcker
Kundservice

Du är på sajten för privatpersoner.

Företag, bibliotek eller offentlig verksamhet?

Du handlar på classic.bokus.com, där alla dina funktioner finns intakta.
Till classic.bokus.com
Bokus logotyp. Gå till startsidan.
  • Erbjudanden
  • Nyheter
  • Student
  • Topplistor
  • Barn & ungdom
  • Bokus Play
  • E-böcker
  • Pocketböcker
  • Spel & pussel

10% rabatt på allt med kod NYSTART10 →

Sidfot

Mina sidor

    Hjälp

    • Kundservice
    • Vanliga frågor och svar
    • Frakt och leverans
    • Retur vid ångerrätt
    • Reklamera vara
    • Betalning
    • Köpvillkor
    • Allmänna villkor
    • Information om webbplatsens tillgänglighet

    Om Bokus

    • Om oss
    • Pressrum
    • För studenter
    • För företag
    • För bibliotek och offentlig verksamhet
    • För leverantörer
    • Hållbarhet

    Populärt

    • Aktuella erbjudanden
    • Presentkort
    • Studentlitteratur
    • Nya böcker
    • Topplistor
    • Signerade böcker
    • Engelska böcker

    Inspiration

    • Boktips
    • BookTok
    • Populära bokserier
    • Barnbokskaraktärer
    • Populära författare
    Logotyp för Bokus
    Följ oss på Facebook (extern länk)Följ oss på Instagram (extern länk)Följ oss på YouTube (extern länk)Följ oss på TikTok (extern länk)
    bokus @ CookiesAnpassa cookiesIntegritetspolicyKöpvillkor
    Till Citymail hemsida (extern länk)Till Budbee hemsida (extern länk)Till Postnord hemsida (extern länk)Till Schenker hemsida (extern länk)Till Early Bird hemsida (extern länk)Till Walleys hemsida (extern länk)
    1. Naturvetenskap och teknik
    2. Matematik och naturvetenskap
    3. Matematik
    4. Matematisk statistik

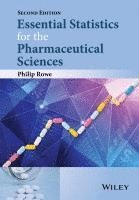
    Essential Statistics for the Pharmaceutical Sciences

    AvPhilip Rowe

    Inbunden, Engelska, 2015

    1 412 kr

    Tillfälligt slut

    Fler format och utgåvor

    E-bok

    2 281 kr

    Häftad

    669 kr

    E-bok

    2 004 kr

    E-bok

    763 kr

    Beskrivning

    Essential Statistics for the Pharmaceutical Sciences is targeted at all those involved in research in pharmacology, pharmacy or other areas of pharmaceutical science; everybody from undergraduate project students to experienced researchers should find the material they need.This book will guide all those who are not specialist statisticians in using sound statistical principles throughout the whole journey of a research project - designing the work, selecting appropriate statistical methodology and correctly interpreting the results.  It deliberately avoids detailed calculation methodology.  Its key features are friendliness and clarity.   All methods are illustrated with realistic examples from within pharmaceutical science.This edition now includes expanded coverage of some of the topics included in the first edition and adds some new topics relevant to pharmaceutical research. a clear, accessible introduction to the key statistical techniques used within the pharmaceutical sciencesall examples set in relevant pharmaceutical contexts.key points emphasised in summary boxes and warnings of potential abuses in ‘pirate boxes’.supplementary material - full data sets and detailed instructions for carrying out analyses using packages such as SPSS or Minitab – provided at:https://www.wiley.com/go/rowe/statspharmascience2eAn invaluable introduction to statistics for any science student and an essential text for all those involved in pharmaceutical research at whatever level.

    Produktinformation

    • Utgivningsdatum:2015-10-02
    • Mått:174 x 250 x 27 mm
    • Vikt:807 g
    • Format:Inbunden
    • Språk:Engelska
    • Antal sidor:440
    • Upplaga:2
    • Förlag:John Wiley and Sons Ltd
    • ISBN:9781118913383

    Utforska kategorier

    • Matematisk statistik inom Naturvetenskap och teknik
    • Farmakologi inom Medicin

    Mer om författaren

    Philip Rowe obtained a BSc in Physiology & Biochemistry at Reading then an MSc in Steroid Endocrinology at Leeds and a PhD at Liverpool University. Then held a post-doctoral fellowship in the Department of Pharmacology and Therapeutics at Liverpool working on the pharmacokinetics of oral contraceptives. In 1980, moved to the School of Pharmacy in Liverpool John Moores University and is now Programme Leader for the Master of Pharmacy programme and Reader in Pharmaceutical Computing.?Various research interests have provided experience in a wide range of data analysis techniques. Has spent the last thirty years developing teaching approaches that allow an appreciation of essential aspects of statistics and pharmacokinetics for the non-mathematical. Apart from teaching these subjects to a wide range of students, also has considerable experience of presenting this material to professional?bodies and industry.

    Innehållsförteckning

    • Preface xiiiStatistical packages xixAbout the website xxiPART 1 PRESENTING DATA 11 Data types 31.1 Does it really matter? 31.2 Interval scale data 41.3 Ordinal scale data 41.4 Nominal scale data 51.5 Structure of this book 61.6 Chapter summary 62 Data presentation 72.1 Numerical tables 82.2 Bar charts and histograms 92.3 Pie charts 142.4 Scatter plots 162.5 Pictorial symbols 212.6 Chapter summary 22PART 2 INTERVAL]SCALE DATA 233 Descriptive statistics for interval scale data 253.1 Summarising data sets 253.2 Indicators of central tendency: Mean, median and mode 263.3 Describing variability – standard deviation and coefficient of variation 333.4 Quartiles – Another way to describe data 363.5 Describing ordinal data 403.6 Using computer packages to generate descriptive statistics 433.7 Chapter summary 454 The normal distribution 474.1 What is a normal distribution? 474.2 Identifying data that are not normally distributed 484.3 Proportions of individuals within 1SD or 2SD of the mean 524.4 Skewness and kurtosis 544.5 Chapter summary 574.6 Appendix: Power, sample size and the problem of attempting to test for a normal distribution 585 Sampling from populations: The standard error of the mean 635.1 Samples and populations 635.2 From sample to population 655.3 Types of sampling error 655.4 What factors control the extent of random sampling error when estimating a population mean? 685.5 Estimating likely sampling error – The SEM 705.6 Offsetting sample size against SD 745.7 Chapter summary 756 95% Confidence interval for the mean and data transformation 776.1 What is a confidence interval? 786.2 How wide should the interval be? 786.3 What do we mean by ‘95%’ confidence? 796.4 Calculating the interval width 806.5 A long series of samples and 95% C.I.s 816.6 How sensitive is the width of the C.I. to changes in the SD, the sample size or the required level of confidence? 826.7 Two statements 856.8 One]sided 95% C.I.s 856.9 The 95% C.I. for the difference between two treatments 886.10 The need for data to follow a normal distribution and data transformation 906.11 Chapter summary 947 The two]sample t]test (1): Introducing hypothesis tests 957.1 The two]sample t]test – an example of an hypothesis test 967.2 Significance 1037.3 The risk of a false positive finding 1047.4 What aspects of the data will influence whether or not we obtain a significant outcome? 1067.5 Requirements for applying a two]sample t]test 1087.6 Performing and reporting the test 1097.7 Chapter summary 1108 The two]sample t]test (2): The dreaded P value 1118.1 Measuring how significant a result is 1118.2 P values 1128.3 Two ways to define significance? 1138.4 Obtaining the P value 1138.5 P values or 95% confidence intervals? 1148.6 Chapter summary 1159 The two]sample t]test (3): False negatives, power and necessary sample sizes 1179.1 What else could possibly go wrong? 1189.2 Power 1199.3 Calculating necessary sample size 1229.4 Chapter summary 13010 The two]sample t]test (4): Statistical significance, practical significance and equivalence 13110.1 Practical significance – Is the difference big enough to matter? 13110.2 Equivalence testing 13510.3 Non]inferiority testing 13910.4 P values are less informative and can be positively misleading 14110.5 Setting equivalence limits prior to experimentation 14310.6 Chapter summary 14411 The two]sample t]test (5): One]sided testing 14511.1 Looking for a change in a specified direction 14611.2 Protection against false positives 14811.3 Temptation! 14911.4 Using a computer package to carry out a one]sided test 15311.5 Chapter summary 15312 What does a statistically significant result really tell us? 15512.1 Interpreting statistical significance 15512.2 Starting from extreme scepticism 15912.3 Bayesian statistics 16012.4 Chapter summary 16113 The paired t]test: Comparing two related sets of measurements 16313.1 Paired data 16313.2 We could analyse the data by a two]sample t]test 16513.3 Using a paired t]test instead 16513.4 Performing a paired t]test 16613.5 What determines whether a paired t]test will be significant? 16913.6 Greater power of the paired t]test 17013.7 Applicability of the test 17013.8 Choice of experimental design 17113.9 Requirement for applying a paired t]test 17213.10 Sample sizes, practical significance and one]sided tests 17313.11 Summarising the differences between paired and two]sample t]tests 17513.12 Chapter summary 17514 Analyses of variance: Going beyond t]tests 17714.1 Extending the complexity of experimental designs 17714.2 One]way analysis of variance 17814.3 T wo]way analysis of variance 18814.4 Fixed and random factors 19814.5 Multi]factorial experiments 20414.6 Chapter summary 20415 Correlation and regression – Relationships between measured values 20715.1 Correlation analysis 20815.2 Regression analysis 21815.3 Multiple regression 22515.4 Chapter summary 23516 Analysis of covariance 23716.1 A clinical trial where ANCOVA would be appropriate 23816.2 General interpretation of ANCOVA results 23916.3 Analysis of the COPD trial results 24116.4 Advantages of ANCOVA over a simple two]sample t]test 24416.5 Chapter summary 249PART 3 NOMINAL]SCALE DATA 25117 D escribing categorised data and the goodness of fit chi]square test 25317.1 Descriptive statistics 25417.2 Testing whether the population proportion might credibly be some pre]determined figure 25817.3 Chapter summary 26418 Contingency chi]square, Fisher’s and McNemar’s tests 26518.1 Using the contingency chi]square test to compare observed proportions 26618.2 Extent of change in proportion with an expulsion – Clinically significant? 27018.3 Larger tables – Attendance at diabetic clinics 27018.4 Planning experimental size 27318.5 Fisher’s exact test 27518.6 McNemar’s test 27718.7 Chapter summary 27918.8 Appendix 28019 Relative risk, odds ratio and number needed to treat 28319.1 Measures of treatment effect – relative risk, odds ratio and number needed to treat 28319.2 Similarity between relative risk and odds ratio 28719.3 Interpreting the various measures 28819.4 95% confidence intervals for measures of effect size 28919.5 Chapter summary 29320 Logistic regression 29520.1 Modelling a binary outcome 29520.2 Additional predictors and the problem of confounding 30420.3 Analysis by computer package 30720.4 Extending logistic regression beyond dichotomous outcomes 30820.5 Chapter summary 30920.6 Appendix 309PART 4 ORDINAL]SCALE DATA 31121 Ordinal and non]normally distributed data: Transformations and non]parametric tests 31321.1 Transforming data to a normal distribution 31421.2 The Mann–Whitney test – a non]parametric method 31821.3 Dealing with ordinal data 32321.4 Other non]parametric methods 32521.5 Chapter summary 33321.6 Appendix 334PART 5 OTHER TOPICS 33722 Measures of agreement 33922.1 Answers to several questions 34022.2 Several answers to one question – do they agree? 34422.3 Chapter summary 35823 Survival analysis 36123.1 What special problems arise with survival data? 36223.2 Kaplan–Meier survival estimation 36323.3 Declining sample sizes in survival studies 36923.4 Precision of sampling estimates of survival 36923.5 Indicators of survival 37123.6 Testing for differences in survival 37423.7 Chapter summary 38324 Multiple testing 38524.1 What is it and why is it a problem? 38524.2 Where does multiple testing arise? 38624.3 Methods to avoid false positives 38824.4 The role of scientific journals 39224.5 Chapter summary 39325 Questionnaires 39525.1 Types of questions 39625.2 Sample sizes and low return rates 39825.3 Analysing the results 39925.4 Problem number two: Confounded questionnaire data 40125.5 Problem number three: Multiple testing with questionnaire data 40125.6 Chapter summary 403Index 405