• Fri frakt över 249 kr
  • •
  • Snabba leveranser
  • •
  • Billiga böcker
Kundservice

Du är på sajten för privatpersoner.

Företag, bibliotek eller offentlig verksamhet?

Du handlar på classic.bokus.com, där alla dina funktioner finns intakta.
Till classic.bokus.com
Bokus logotyp. Gå till startsidan.
  • Erbjudanden
  • Nyheter
  • Student
  • Topplistor
  • Barn & ungdom
  • Bokus Play
  • E-böcker
  • Pocketböcker
  • Spel & pussel

10% rabatt på allt med kod NYSTART10 →

Sidfot

Mina sidor

    Hjälp

    • Kundservice
    • Vanliga frågor och svar
    • Frakt och leverans
    • Retur vid ångerrätt
    • Reklamera vara
    • Betalning
    • Köpvillkor
    • Allmänna villkor
    • Information om webbplatsens tillgänglighet

    Om Bokus

    • Om oss
    • Pressrum
    • För studenter
    • För företag
    • För bibliotek och offentlig verksamhet
    • För leverantörer
    • Hållbarhet

    Populärt

    • Aktuella erbjudanden
    • Presentkort
    • Studentlitteratur
    • Nya böcker
    • Topplistor
    • Signerade böcker
    • Engelska böcker

    Inspiration

    • Boktips
    • BookTok
    • Populära bokserier
    • Barnbokskaraktärer
    • Populära författare
    Logotyp för Bokus
    Följ oss på Facebook (extern länk)Följ oss på Instagram (extern länk)Följ oss på YouTube (extern länk)Följ oss på TikTok (extern länk)
    bokus @ CookiesAnpassa cookiesIntegritetspolicyKöpvillkor
    Till Citymail hemsida (extern länk)Till Budbee hemsida (extern länk)Till Postnord hemsida (extern länk)Till Schenker hemsida (extern länk)Till Early Bird hemsida (extern länk)Till Walleys hemsida (extern länk)
    1. Data och IT
    2. Programmeringsböcker
    3. Programspråk

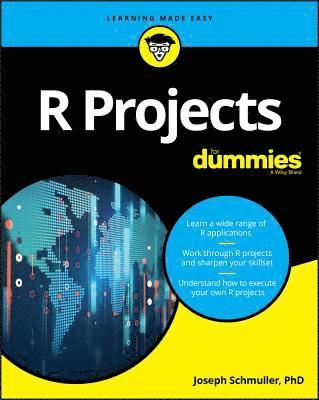
    R Projects For Dummies

    AvJoseph Schmuller

    Häftad, Engelska, 2018

    222 kr

    Beställningsvara. Skickas inom 5-8 vardagar. Fri frakt över 249 kr.

    Fler format och utgåvor

    E-bok

    261 kr

    E-bok

    261 kr

    Beskrivning

    Make the most of R’s extensive toolsetR Projects For Dummies offers a unique learn-by-doing approach. You will increase the depth and breadth of your R skillset by completing a wide variety of projects. By using R’s graphics, interactive, and machine learning tools, you’ll learn to apply R’s extensive capabilities in an array of scenarios. The depth of the project experience is unmatched by any other content online or in print. And you just might increase your statistics knowledge along the way, too!R is a free tool, and it’s the basis of a huge amount of work in data science. It's taking the place of costly statistical software that sometimes takes a long time to learn. One reason is that you can use just a few R commands to create sophisticated analyses. Another is that easy-to-learn R graphics enable you make the results of those analyses available to a wide audience.This book will help you sharpen your skills by applying them in the context of projects with R, including dashboards, image processing, data reduction, mapping, and more. Appropriate for R users at all levelsHelps R programmers plan and complete their own projectsFocuses on R functions and packagesShows how to carry out complex analyses by just entering a few commandsIf you’re brand new to R or just want to brush up on your skills, R Projects For Dummies will help you complete your projects with ease.

    Produktinformation

    • Utgivningsdatum:2018-04-11
    • Mått:185 x 234 x 23 mm
    • Vikt:476 g
    • Format:Häftad
    • Språk:Engelska
    • Antal sidor:368
    • Förlag:John Wiley & Sons Inc
    • ISBN:9781119446187

    Utforska kategorier

    • Programspråk inom Data och IT

    Mer om författaren

    Joseph Schmuller, PhD, is a veteran of more than 25 years in Information Technology. He is the author of several books, including Statistical Analysis with R For Dummies and four editions of Statistical Analysis with Excel For Dummies. In addition, he has written numerous articles and created online coursework for Lynda.com.

    Innehållsförteckning

    • Introduction 1About This Book 2Part 1: The Tools of the Trade 2Part 2: Interacting with a User 2Part 3: Machine Learning 2Part 4: Large(ish) Data Sets 2Part 5: Maps and Images 2Part 6: The Part of Tens 3What You Can Safely Skip 3Foolish Assumptions 3Icons Used in This Book 3Beyond the Book 4Where to Go from Here 4Part 1: the Tools of the Trade 5Chapter 1: R: What It Does and How It Does It 7Getting R 7Getting RStudio 8A Session with R 11The working directory 11Getting started 12R Functions 15User-Defined Functions 16Comments 18R Structures 18Vectors 18Numerical vectors 19Matrices 21Lists 24Data frames 25Of for Loops and if Statements 28Chapter 2: Working with Packages 31Installing Packages 31Examining Data 33Heads and tails 33Missing data 33Subsets 34R Formulas 35More Packages 36Exploring the tidyverse 37Chapter 3: Getting Graphic 43Touching Base 43Histograms 44Density plots 45Bar plots 47Grouping the bars 49Quick Suggested Project 51Pie graphs 53Scatterplots 53Scatterplot matrix 55Box plots 56Graduating to ggplot2 57How it works 58Histograms 59Bar plots 61Grouped bar plots 62Grouping yet again 64Scatterplots 67The plot thickens 68Scatterplot matrix 72Box plots 73Part 2: Interacting with a User 77Chapter 4: Working with a Browser 79Getting Your Shine On 79Creating Your First shiny Project 80The user interface 83The server 84Final steps 85Getting reactive 86Working with ggplot 89Changing the server 90A few more changes 92Getting reactive with ggplot 94Another shiny Project 96The base R version 97The ggplot version 104Suggested Project 106Chapter 5: Dashboards — How Dashing! 107The shinydashboard Package 107Exploring Dashboard Layouts 108Getting started with the user interface 109Building the user interface: Boxes, boxes, boxes 110Lining up in columns 117A nice trick: Keeping tabs 121Suggested project: Add statistics 125Suggested project: Place valueBoxes in tabPanels 126Working with the Sidebar 126The user interface 128The server 131Suggested project: Relocate the slider 133Interacting with Graphics 135Clicks, double-clicks, and brushes — oh, my! 135Why bother with all this? 138Suggested project: Experiment with airquality 141Part 3: Machine Learning 143Chapter 6: Tools and Data for Machine Learning Projects 145The UCI (University of California-Irvine) ML Repository 146Downloading a UCI dataset 146Cleaning up the data 148Exploring the data 150Exploring relationships in the data 152Introducing the Rattle package 157Using Rattle with iris 159Getting and (further) exploring the data 159Finding clusters in the data 162Chapter 7: Decisions, Decisions, Decisions 167Decision Tree Components 167Roots and leaves 168Tree construction 168Decision Trees in R 169Growing the tree in R 169Drawing the tree in R 171Decision Trees in Rattle 173Creating the tree 174Drawing the tree 175Evaluating the tree 176Project: A More Complex Decision Tree 177The data: Car evaluation 177Data exploration 179Building and drawing the tree 180Evaluating the tree 181Quick suggested project: Understanding the complexity parameter 181Suggested Project: Titanic 182Chapter 8: Into the Forest, Randomly 185Growing a Random Forest 185Random Forests in R 187Building the forest 187Evaluating the forest 189A closer look 190Plotting error 191Plotting importance 193Project: Identifying Glass 194The data 194Getting the data into Rattle 195Exploring the data 196Growing the random forest 198Visualizing the results 198Suggested Project: Identifying Mushrooms 200Chapter 9: Support Your Local Vector 201Some Data to Work With 201Using a subset 202Defining a boundary 202Understanding support vectors 203Separability: It’s Usually Nonlinear 205Support Vector Machines in R 207Working with e1071 207Working with kernlab 212Project: House Parties 214Reading in the data 216Exploring the data 217Creating the SVM 218Evaluating the SVM 220Suggested Project: Titanic Again 220Chapter 10: K-Means Clustering 221How It Works 221K-Means Clustering in R 223Setting up and analyzing the data 223Understanding the output 224Visualizing the clusters 225Finding the optimum number of clusters 226Quick suggested project: Adding the sepals 229Project: Glass Clusters 231The data 231Starting Rattle and exploring the data 232Preparing to cluster 233Doing the clustering 234Going beyond Rattle 234Suggested Project: A Few Quick Ones 235Visualizing data points and clusters 235The optimum number of clusters 236Adding variables 236Chapter 11: Neural Networks 237Networks in the Nervous System 237Artificial Neural Networks 238Overview 238Input layer and hidden layer 239Output layer 240How it all works 240Neural Networks in R 241Building a neural network for the iris data frame 241Plotting the network 243Evaluating the network 244Quick suggested project: Those sepals 245Project: Banknotes 245The data 245Taking a quick look ahead 246Setting up Rattle 247Evaluating the network 249Going beyond Rattle: Visualizing the network 249Suggested Projects: Rattling Around 251Part 4: Large(ish) Data Sets 253Chapter 12: Exploring Marketing 255Project: Analyzing Retail Data 255The data 256RFM in R 257Enter Machine Learning 265K-means clustering 265Working with Rattle 267Digging into the clusters 268The clusters and the classes 270Quick suggested project 271Suggested Project: Another Data Set 272Chapter 13: From the City That Never Sleeps 275Examining the Data Set 275Warming Up 276Glimpsing and viewing 276Piping, filtering, and grouping 277Visualizing 279Joining 280Quick Suggested Project: Airline names 283Project: Departure Delays 283Adding a variable: weekday 283Quick Suggested Project: Analyze weekday differences 284Delay, weekday, and airport 285Delay and flight duration 287Suggested Project: Delay and Weather 289Part 5: Maps and Images 291Chapter 14: All Over the Map 293Project: The Airports of Wisconsin 293Dispensing with the preliminaries 293Getting the state geographic data 294Getting the airport geographic data 295Plotting the airports on the state map 298Quick Suggested Project: Another source of airport geographic info 299Suggested Project 1: Map Your State 299Suggested Project 2: Map the Country 299Plotting the state capitals 301Plotting the airports 302Chapter 15: Fun with Pictures 305Polishing a Picture: It’s magick! 305Reading the image 306Rotating, flipping, and flopping 307Annotating 308Combining transformations 309Quick suggested project: Three F’s 309Combining images 310Animating 311Making your own morphs 312Project: Two Legends in Search of a Legend 313Getting Stan and Ollie 313Combining the boys with the background 314Explaining image_apply() 314Getting back to the animation 316Suggested Project: Combine an Animation with a Plot 316Part 6: the Part of Tens 319Chapter 16: More Than Ten Packages for Your R Projects 321Machine Learning 321Databases 322Maps 322Image Processing 324Text Analysis 324Chapter 17: More than Ten Useful Resources 327Interacting with Users 327Machine Learning 328Databases 328Maps and Images 329Index 331