• Fri frakt över 249 kr
  • •
  • Snabba leveranser
  • •
  • Billiga böcker
Kundservice

Du är på sajten för privatpersoner.

Företag, bibliotek eller offentlig verksamhet?

Du handlar på classic.bokus.com, där alla dina funktioner finns intakta.
Till classic.bokus.com
Bokus logotyp. Gå till startsidan.
  • Erbjudanden
  • Nyheter
  • Student
  • Topplistor
  • Barn & ungdom
  • Bokus Play
  • E-böcker
  • Pocketböcker
  • Spel & pussel

10% rabatt på allt med kod NYSTART10 →

Sidfot

Mina sidor

    Hjälp

    • Kundservice
    • Vanliga frågor och svar
    • Frakt och leverans
    • Retur vid ångerrätt
    • Reklamera vara
    • Betalning
    • Köpvillkor
    • Allmänna villkor
    • Information om webbplatsens tillgänglighet

    Om Bokus

    • Om oss
    • Pressrum
    • För studenter
    • För företag
    • För bibliotek och offentlig verksamhet
    • För leverantörer
    • Hållbarhet

    Populärt

    • Aktuella erbjudanden
    • Presentkort
    • Studentlitteratur
    • Nya böcker
    • Topplistor
    • Signerade böcker
    • Engelska böcker

    Inspiration

    • Boktips
    • BookTok
    • Populära bokserier
    • Barnbokskaraktärer
    • Populära författare
    Logotyp för Bokus
    Följ oss på Facebook (extern länk)Följ oss på Instagram (extern länk)Följ oss på YouTube (extern länk)Följ oss på TikTok (extern länk)
    bokus @ CookiesAnpassa cookiesIntegritetspolicyKöpvillkor
    Till Citymail hemsida (extern länk)Till Budbee hemsida (extern länk)Till Postnord hemsida (extern länk)Till Schenker hemsida (extern länk)Till Early Bird hemsida (extern länk)Till Walleys hemsida (extern länk)
    1. Naturvetenskap och teknik
    2. Matematik och naturvetenskap
    3. Matematik
    4. Optimering

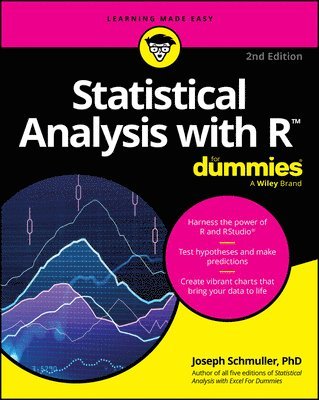
    Statistical Analysis with R For Dummies

    AvJoseph Schmuller

    Häftad, Engelska, 2025

    Del i serien For Dummies

    261 kr

    Beställningsvara. Skickas inom 5-8 vardagar. Fri frakt över 249 kr.

    Fler format och utgåvor

    Häftad

    325 kr

    E-bok

    273 kr

    E-bok

    273 kr

    E-bok

    363 kr

    E-bok

    363 kr

    Beskrivning

    Simplify stats and learn how to graph, analyze, and interpret data the easy wayStatistical Analysis with R For Dummies makes stats approachable by combining clear explanations with practical applications. You'll learn how to download and use R and RStudio—two free, open-source tools—to learn statistics concepts, create graphs, test hypotheses, and draw meaningful conclusions. Get started by learning the basics of statistics and R, calculate descriptive statistics, and use inferential statistics to test hypotheses. Then, visualize it all with graphs and charts. This Dummies guide is your well-marked path to sailing through statistics. Get clear explanations of the basics of statistics and data analysisLearn how to analyze and visualize data with R, step by stepCreate charts, graphs, and summaries to interpret resultsExplore hypothesis testing, and prediction techniquesThis is the perfect introduction to R for students, professionals, and the stat-curious.

    Produktinformation

    • Utgivningsdatum:2025-06-19
    • Mått:230 x 20 x 180 mm
    • Vikt:845 g
    • Format:Häftad
    • Språk:Engelska
    • Serie:For Dummies
    • Antal sidor:464
    • Upplaga:2
    • Förlag:John Wiley & Sons Inc
    • ISBN:9781394343065

    Utforska kategorier

    • Optimering inom Naturvetenskap och teknik
    • Affärsapplikationer inom Data och IT
    • Programmeringsböcker inom Data och IT

    Mer om författaren

    Joseph Schmuller is a cognitive scientist and statistical analyst who creates online learning tools and books on data science. He is the author of R All-in One For Dummies, all five editions of Statistical Analysis with Excel For Dummies, Statistical Analysis with R For Dummies, and R Projects For Dummies, among others.

    Innehållsförteckning

    • Introduction 1Part 1: Getting Started with Statistical Analysis with R. 7Chapter 1: Data, Statistics, and Decisions 9Chapter 2: R: What It Does and How It Does It 17Part 2: Describing Data 47Chapter 3: Getting Graphic 49Chapter 4: Finding Your Center 79Chapter 5: Deviating from the Average 91Chapter 6: Meeting Standards and Standings 101Chapter 7: Summarizing It All 113Chapter 8: What’s Normal? 133Part 3: Drawing Conclusions from Data 153Chapter 9: The Confidence Game: Estimation 155Chapter 10: One-Sample Hypothesis Testing 171Chapter 11: Two-Sample Hypothesis Testing 197Chapter 12: Testing More than Two Samples 223Chapter 13: More Complicated Testing 249Chapter 14: Regression: Linear, Multiple, and the General Linear Model 273Chapter 15: Correlation: The Rise and Fall of Relationships 311Chapter 16: Curvilinear Regression: When Relationships Get Complicated 333Part 4: Working with Probability 357Chapter 17: Introducing Probability 359Chapter 18: Introducing Modeling 381Chapter 19: Probability Meets Regression: Logistic Regression 403Part 5: The Part of Tens 413Chapter 20: Ten Tips for Excel Émigrés 415Chapter 21: Ten Valuable Online R Resources 429Index 433