• Fri frakt över 249 kr
  • •
  • Snabba leveranser
  • •
  • Billiga böcker
Kundservice

Du är på sajten för privatpersoner.

Företag, bibliotek eller offentlig verksamhet?

Du handlar på classic.bokus.com, där alla dina funktioner finns intakta.
Till classic.bokus.com
Bokus logotyp. Gå till startsidan.
  • Erbjudanden
  • Nyheter
  • Student
  • Topplistor
  • Barn & ungdom
  • Bokus Play
  • E-böcker
  • Pocketböcker
  • Spel & pussel

10% rabatt på allt med kod: NYSTART10 →

Sidfot

Mina sidor

    Hjälp

    • Kundservice
    • Vanliga frågor och svar
    • Frakt och leverans
    • Retur vid ångerrätt
    • Reklamera vara
    • Betalning
    • Köpvillkor
    • Allmänna villkor
    • Information om webbplatsens tillgänglighet

    Om Bokus

    • Om oss
    • Pressrum
    • För studenter
    • För företag
    • För bibliotek och offentlig verksamhet
    • För leverantörer
    • Hållbarhet

    Populärt

    • Aktuella erbjudanden
    • Presentkort
    • Studentlitteratur
    • Nya böcker
    • Topplistor
    • Signerade böcker
    • Engelska böcker

    Inspiration

    • Boktips
    • BookTok
    • Populära bokserier
    • Barnbokskaraktärer
    • Populära författare
    Logotyp för Bokus
    Följ oss på Facebook (extern länk)Följ oss på Instagram (extern länk)Följ oss på YouTube (extern länk)Följ oss på TikTok (extern länk)
    bokus @ CookiesAnpassa cookiesIntegritetspolicyKöpvillkor
    Till Citymail hemsida (extern länk)Till Budbee hemsida (extern länk)Till Postnord hemsida (extern länk)Till Schenker hemsida (extern länk)Till Early Bird hemsida (extern länk)Till Walleys hemsida (extern länk)
    1. Naturvetenskap och teknik
    2. Matematik och naturvetenskap
    3. Matematik
    4. Matematisk statistik

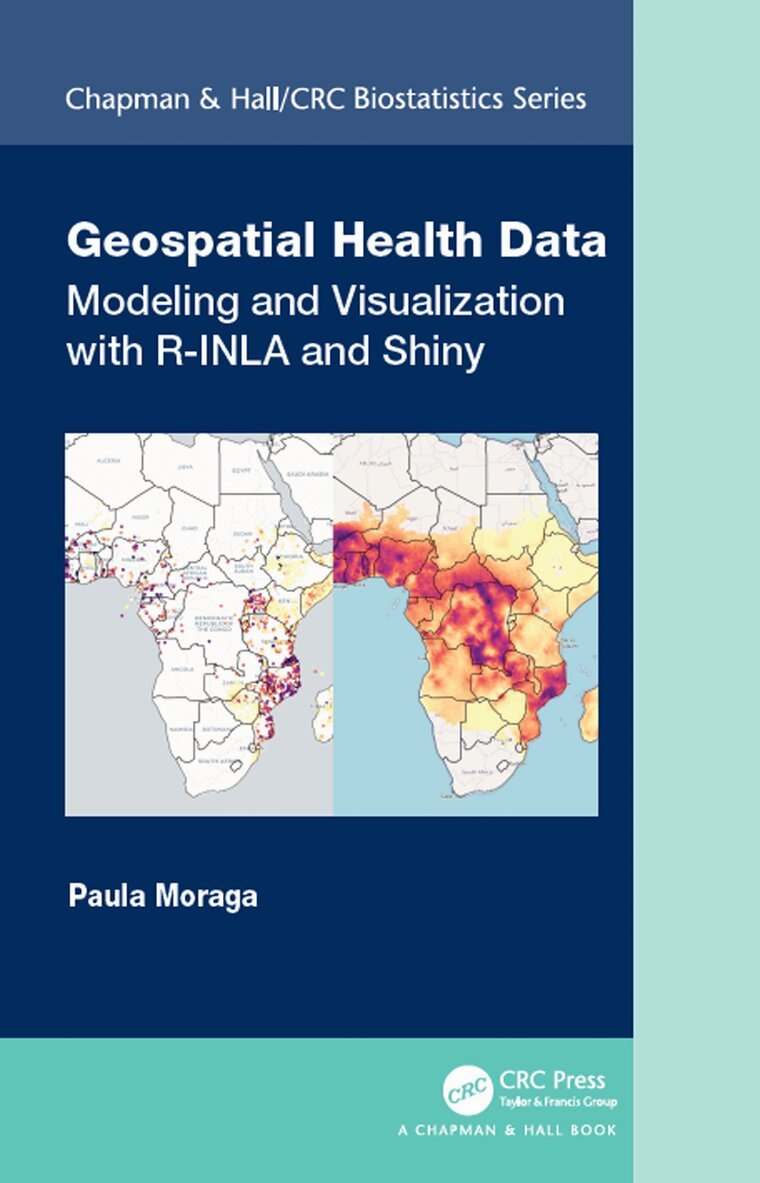
    Geospatial Health Data

    Modeling and Visualization with R-INLA and Shiny

    AvPaula Moraga

    Inbunden, Engelska, 2019

    Del i serien Chapman & Hall/CRC Biostatistics Series

    1 510 kr

    Beställningsvara. Skickas inom 10-15 vardagar. Fri frakt över 249 kr.

    Fler format och utgåvor

    E-bok

    1 019 kr

    E-bok

    1 019 kr

    Beskrivning

    Geospatial health data are essential to inform public health and policy. These data can be used to quantify disease burden, understand geographic and temporal patterns, identify risk factors, and measure inequalities. Geospatial Health Data: Modeling and Visualization with R-INLA and Shiny describes spatial and spatio-temporal statistical methods and visualization techniques to analyze georeferenced health data in R. The book covers the following topics: Manipulating and transforming point, areal, and raster data, Bayesian hierarchical models for disease mapping using areal and geostatistical data, Fitting and interpreting spatial and spatio-temporal models with the integrated nested Laplace approximation (INLA) and the stochastic partial differential equation (SPDE) approaches, Creating interactive and static visualizations such as disease maps and time plots, Reproducible R Markdown reports, interactive dashboards, and Shiny web applications that facilitate the communication of insights to collaborators and policymakers.The book features fully reproducible examples of several disease and environmental applications using real-world data such as malaria in The Gambia, cancer in Scotland and USA, and air pollution in Spain. Examples in the book focus on health applications, but the approaches covered are also applicable to other fields that use georeferenced data including epidemiology, ecology, demography or criminology. The book provides clear descriptions of the R code for data importing, manipulation, modelling, and visualization, as well as the interpretation of the results. This ensures contents are fully reproducible and accessible for students, researchers and practitioners.

    Produktinformation

    • Utgivningsdatum:2019-11-25
    • Mått:156 x 234 x 17 mm
    • Vikt:580 g
    • Format:Inbunden
    • Språk:Engelska
    • Serie:Chapman & Hall/CRC Biostatistics Series
    • Antal sidor:274
    • Förlag:Taylor & Francis Ltd
    • ISBN:9780367357955

    Utforska kategorier

    • Matematisk statistik inom Naturvetenskap och teknik
    • Epidemiologi och medicinsk statistik inom Medicin

    Mer om författaren

    Paula Moraga is a Lecturer in the Department of Mathematical Sciences at the University of Bath. She received her Master’s in Biostatistics from Harvard University and her Ph.D. in Statistics from the University of Valencia. Dr. Moraga develops innovative statistical methods and open-source software for disease surveillance including R packages for spatio-temporal modeling, detection of clusters, and travel-related spread of disease. Her work has directly informed strategic policy in reducing the burden of diseases such as malaria and cancer in several countries.

    Recensioner i media

    "The stress is on practical usage of INLA modelling in a spatial context and hence the author shows the full code for several carefully selected examples. Essentially all the steps from the beginning (necessary data manipulation and preparation) via INLA analysis itself (often in several alternatives) to the results (plots and maps) are explained carefully and commented. This is very useful for anybody who wants to start with the powerful INLA but did not dare to go through the very powerful but notalways- fully-documented environment." ~Marek Brabec, ISCB News

    Innehållsförteckning

    • 1. Geospatial health. 2. Spatial data and R packages for mapping. 3. Bayesian inference and INLA. 4. The R-INLA package. 5. Areal data. 6. Spatial modeling of areal data. 7. Spatio-temporal modeling of areal data. 8. Geostatistical data. 9. Spatial modeling of geostatistical data. 10. Spatio-temporal modeling of geostatistical data. 11. Introduction to R Markdown. 12. Building a dashboard to visualize spatial data with flexdashboard. 13. Introduction to Shiny. 14. Interactive dashboards with flexdashboard and Shiny. 15. Building a Shiny app to upload and visualize spatio-temporal data. 16. Disease surveillance with SpatialEpiApp.