• Fri frakt över 249 kr
  • •
  • Snabba leveranser
  • •
  • Billiga böcker
Kundservice

Du är på sajten för privatpersoner.

Företag, bibliotek eller offentlig verksamhet?

Du handlar på classic.bokus.com, där alla dina funktioner finns intakta.
Till classic.bokus.com
Bokus logotyp. Gå till startsidan.
  • Erbjudanden
  • Nyheter
  • Student
  • Topplistor
  • Barn & ungdom
  • Bokus Play
  • E-böcker
  • Pocketböcker
  • Spel & pussel

10% rabatt på allt med kod: NYSTART10 →

Sidfot

Mina sidor

    Hjälp

    • Kundservice
    • Vanliga frågor och svar
    • Frakt och leverans
    • Retur vid ångerrätt
    • Reklamera vara
    • Betalning
    • Köpvillkor
    • Allmänna villkor
    • Information om webbplatsens tillgänglighet

    Om Bokus

    • Om oss
    • Pressrum
    • För studenter
    • För företag
    • För bibliotek och offentlig verksamhet
    • För leverantörer
    • Hållbarhet

    Populärt

    • Aktuella erbjudanden
    • Presentkort
    • Studentlitteratur
    • Nya böcker
    • Topplistor
    • Signerade böcker
    • Engelska böcker

    Inspiration

    • Boktips
    • BookTok
    • Populära bokserier
    • Barnbokskaraktärer
    • Populära författare
    Logotyp för Bokus
    Följ oss på Facebook (extern länk)Följ oss på Instagram (extern länk)Följ oss på YouTube (extern länk)Följ oss på TikTok (extern länk)
    bokus @ CookiesAnpassa cookiesIntegritetspolicyKöpvillkor
    Till Citymail hemsida (extern länk)Till Budbee hemsida (extern länk)Till Postnord hemsida (extern länk)Till Schenker hemsida (extern länk)Till Early Bird hemsida (extern länk)Till Walleys hemsida (extern länk)
    1. Naturvetenskap och teknik
    2. Matematik och naturvetenskap
    3. Matematik

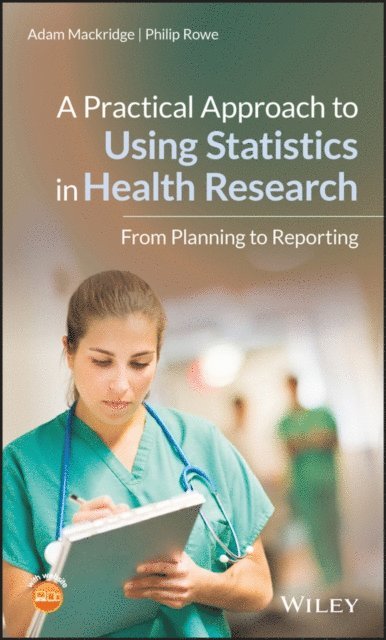
    Practical Approach to Using Statistics in Health Research

    From Planning to Reporting

    AvAdam Mackridge,Philip Rowe

    Inbunden, Engelska, 2018

    1 419 kr

    Beställningsvara. Skickas inom 5-8 vardagar. Fri frakt över 249 kr.

    Beskrivning

    A hands-on guide to using statistics in health research, from planning, through analysis, and on to reportingA Practical Approach to Using Statistics in Health Research offers an easy to use, step-by-step guide for using statistics in health research. The authors use their experience of statistics and health research to explain how statistics fit in to all stages of the research process. They explain how to determine necessary sample sizes, interpret whether there are statistically significant difference in outcomes between groups, and use measured effect sizes to decide whether any changes are large enough to be relevant to professional practice.The text walks you through how to identify the main outcome measure for your study and the factor which you think may influence that outcome and then determine what type of data will be used to record both of these.  It then describes how this information is used to select the most appropriate methods to report and analyze your data.  A step-by-step guide on how to use a range of common statistical procedures are then presented in separate chapters.  To help you make sure that you are using statistics robustly, the authors also explore topics such as multiple testing and how to check whether measured data follows a normal distribution.  Videos showing how to use computer packages to carry out all the various methods mentioned in the book are available on our companion web site. This book:•    Covers statistical aspects of all the stages of health research from planning to final reporting•    Explains how to report statistical planning, how analyses were performed, and the results and conclusion•    Puts the spotlight on consideration of clinical significance and not just statistical significance•    Explains the importance of reporting 95% confidence intervals for effect size•    Includes a systematic guide for selection of statistical tests and uses example data sets and videos to help you understand exactly how to use statisticsWritten as an introductory guide to statistics for healthcare professionals, students and lecturers in the fields of pharmacy, nursing, medicine, dentistry, physiotherapy, and occupational therapy, A Practical Approach to Using Statistics in Health Research:From Planning to Reporting is a handy reference that focuses on the application of statistical methods within the health research context.

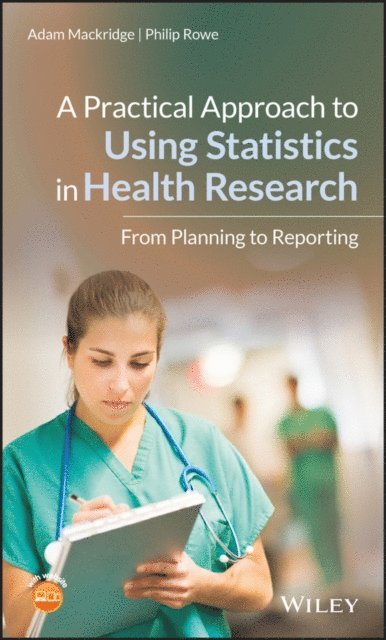
    Produktinformation

    • Utgivningsdatum:2018-06-08
    • Mått:145 x 221 x 18 mm
    • Vikt:476 g
    • Format:Inbunden
    • Språk:Engelska
    • Antal sidor:240
    • Förlag:John Wiley & Sons Inc
    • ISBN:9781119383574

    Utforska kategorier

    • Matematik inom Naturvetenskap och teknik
    • Epidemiologi och medicinsk statistik inom Medicin

    Mer om författaren

    Adam Mackridge, Ph.D., is a Research Pharmacist at Betsi Cadwaladr University Health Board in North Wales. He has over 15 years of experience in planning, conducting and reporting health research. He received his PhD in Pharmacy Practice from Aston University in Birmingham, UK. Philip Rowe, Ph.D., is a Visiting Research Fellow in the School of Pharmacy and Molecular Sciences at Liverpool John Moores University, Liverpool, UK. He is a Fellow of the Royal Statistical Society and has authored other statistically based books for Wiley.

    Innehållsförteckning

    • About the Companion Website xv1 Introduction 11.1 At Whom is This Book Aimed? 11.2 At What Scale of Project is This Book Aimed? 21.3 Why Might This Book be Useful for You? 21.4 How to Use This Book 31.5 Computer Based Statistics Packages 41.6 Relevant Videos etc. 52 Data Types 72.1 What Types of Data are There and Why Does it Matter? 72.2 Continuous Measured Data 72.2.1 Continuous Measured Data – Normal and Non‐Normal Distribution 82.2.2 Transforming Non‐Normal Data 132.3 Ordinal Data 132.4 Categorical Data 142.5 Ambiguous Cases 142.5.1 A Continuously Varying Measure that has been Divided into a Small Number of Ranges 142.5.2 Composite Scores with a Wide Range of Possible Values 152.6 Relevant Videos etc. 153 Presenting and Summarizing Data 173.1 Continuous Measured Data 173.1.1 Normally Distributed Data – Using the Mean and Standard Deviation 183.1.2 Data With Outliers, e.g. Skewed Data – Using Quartiles and the Median 183.1.3 Polymodal Data – Using the Modes 203.2 Ordinal Data 213.2.1 Ordinal Scales With a Narrow Range of Possible Values 223.2.2 Ordinal Scales With a Wide Range of Possible Values 223.2.3 Dividing an Ordinal Scale Into a Small Number of Ranges (e.g. Satisfactory/Unsatisfactory or Poor/Acceptable/Good) 223.2.4 Summary for Ordinal Data 233.3 Categorical Data 233.4 Relevant Videos etc. 24Appendix 1: An Example of the Insensitivity of the Median When Used to Describe Data from an Ordinal Scale With a Narrow Range of Possible Values 254 Choosing a Statistical Test 274.1 Identify the Factor and Outcome 274.2 Identify the Type of Data Used to Record the Relevant Factor 294.3 Statistical Methods Where the Factor is Categorical 304.3.1 Identify the Type of Data Used to Record the Outcome 304.3.2 Is Continuous Measured Outcome Data Normally Distributed or Can It Be Transformed to Normality? 304.3.3 Identify Whether Your Sets of Outcome Data Are Related or Independent 314.3.4 For the Factor, How Many Levels Are Being Studied? 324.3.5 Determine the Appropriate Statistical Method for Studies with a Categorical Factor 324.4 Correlation and Regression with a Measured Factor 344.4.1 What Type of Data Was Used to Record Your Factor and Outcome? 344.4.2 When Both the Factor and the Outcome Consist of Continuous Measured Values, Select Between Pearson and Spearman Correlation 344.5 Relevant Additional Material 385 Multiple Testing 395.1 What Is Multiple Testing and Why Does It Matter? 395.2 What Can We Do to Avoid an Excessive Risk of False Positives? 405.2.1 Use of Omnibus Tests 405.2.2 Distinguishing Between Primary and Secondary/ Exploratory Analyses 405.2.3 Bonferroni Correction 416 Common Issues and Pitfalls 436.1 Determining Equality of Standard Deviations 436.2 How Do I Know, in Advance, How Large My SD Will Be? 436.3 One‐Sided Versus Two‐Sided Testing 446.4 Pitfalls That Make Data Look More Meaningful Than It Really Is 456.4.1 Too Many Decimal Places 456.4.2 Percentages with Small Sample Sizes 476.5 Discussion of Statistically Significant Results 476.6 Discussion of Non‐Significant Results 506.7 Describing Effect Sizes with Non‐Parametric Tests 516.8 Confusing Association with a Cause and Effect Relationship 527 Contingency Chi‐Square Test 557.1 When Is the Test Appropriate? 557.2 An Example 557.3 Presenting the Data 577.3.1 Contingency Tables 577.3.2 Clustered or Stacked Bar Charts 577.4 Data Requirements 597.5 An Outline of the Test 597.6 Planning Sample Sizes 597.7 Carrying Out the Test 607.8 Special Issues 617.8.1 Yates Correction 617.8.2 Low Expected Frequencies – Fisher’s Exact Test 617.9 Describing the Effect Size 617.9.1 Absolute Risk Difference (ARD) 627.9.2 Number Needed to Treat (NNT) 637.9.3 Risk Ratio (RR) 637.9.4 Odds Ratio (OR) 647.9.5 Case: Control Studies 657.10 How to Report the Analysis 657.10.1 Methods 657.10.2 Results 667.10.3 Discussion 677.11 Confounding and Logistic Regression 677.11.1 Reporting the Detection of Confounding 687.12 Larger Tables 697.12.1 Collapsing Tables 697 12.2 Reducing Tables 707.13 Relevant Videos etc. 718 Independent Samples (Two‐Sample) T‐Test 738.1 When Is the Test Applied? 738.2 An Example 738.3 Presenting the Data 758.3.1 Numerically 758.3.2 Graphically 758.4 Data Requirements 758.4.1 Variables Required 758.4.2 Normal Distribution of the Outcome Variable Within the Two Samples 758.4.3 Equal Standard Deviations 788.4.4 Equal Sample Sizes 788.5 An Outline of the Test 788.6 Planning Sample Sizes 798.7 Carrying Out the Test 798.8 Describing the Effect Size 798.9 How to Describe the Test, the Statistical and Practical Significance of Your Findings in Your Report 808.9.1 Methods Section 808.9.2 Results Section 808.9.3 Discussion Section 818.10 Relevant Videos etc. 819 Mann–Whitney Test 839.1 When Is the Test Applied? 839.2 An Example 839.3 Presenting the Data 859.3.1 Numerically 859.3.2 Graphically 859.3.3 Divide the Outcomes into Low and High Ranges 859.4 Data Requirements 869.4.1 Variables Required 869.4.2 Normal Distributions and Equality of Standard Deviations 879.4.3 Equal Sample Sizes 879.5 An Outline of the Test 879.6 Statistical Significance 879.7 Planning Sample Sizes 879.8 Carrying Out the Test 889.9 Describing the Effect Size 889.10 How to Report the Test 899.10.1 Methods Section 899.10.2 Results Section 899.10.3 Discussion Section 909.11 Relevant Videos etc. 9110 One‐Way Analysis of Variance (ANOVA) – Including Dunnett’s and Tukey’s Follow Up Tests 9310.1 When Is the Test Applied? 9310.2 An Example 9310.3 Presenting the Data 9410.3.1 Numerically 9410.3.2 Graphically 9410.4 Data Requirements 9410.4.1 Variables Required 9410.4.2 Normality of Distribution for the Outcome Variable Within the Three Samples 9510.4.3 Standard Deviations 9610.4.4 Sample Sizes 9810.5 An Outline of the Test 9810.6 Follow Up Tests 9810.7 Planning Sample Sizes 9910.8 Carrying Out the Test 10010.9 Describing the Effect Size 10110.10 How to Report the Test 10110.10.1 Methods 10110.10.2 Results Section 10210.10.3 Discussion Section 10210.11 Relevant Videos etc. 10311 Kruskal–Wallis 10511.1 When Is the Test Applied? 10511.2 An Example 10511.3 Presenting the Data 10611.3.1 Numerically 10611.3.2 Graphically 10711.4 Data Requirements 10911.4.1 Variables Required 10911.4.2 Normal Distributions and Standard Deviations 10911.4.3 Equal Sample Sizes 11011.5 An Outline of the Test 11011.6 Planning Sample Sizes 11011.7 Carrying Out the Test 11011.8 Describing the Effect Size 11111.9 Determining Which Group Differs from Which Other 11111.10 How to Report the Test 11111.10.1 Methods Section 11111.10.2 Results Section 11211.10.3 Discussion Section 11311.11 Relevant Videos etc. 11412 McNemar’s Test 11512.1 When Is the Test Applied? 11512.2 An Example 11512.3 Presenting the Data 11612.4 Data Requirements 11612.5 An Outline of the Test 11812.6 Planning Sample Sizes 11812.7 Carrying Out the Test 11912.8 Describing the Effect Size 11912.9 How to Report the Test 11912.9.1 Methods Section 11912.9.2 Results Section 12012.9.3 Discussion Section 12012.10 Relevant Videos etc. 12113 Paired T‐Test 12313.1 When Is the Test Applied? 12313.2 An Example 12513.3 Presenting the Data 12513.3.1 Numerically 12513.3.2 Graphically 12513.4 Data Requirements 12613.4.1 Variables Required 12613.4.2 Normal Distribution of the Outcome Data 12613.4.3 Equal Standard Deviations 12813.4.4 Equal Sample Sizes 12813.5 An Outline of the Test 12813.6 Planning Sample Sizes 12913.7 Carrying Out the Test 12913.8 Describing the Effect Size 12913.9 How to Report the Test 13013.9.1 Methods Section 13013.9.2 Results Section 13013.9.3 Discussion Section 13113.10 Relevant Videos etc. 13114 Wilcoxon Signed Rank Test 13314.1 When Is the Test Applied? 13314.2 An Example 13414.3 Presenting the Data 13414.3.1 Numerically 13414.3.2 Graphically 13614.4 Data Requirements 13614.4.1 Variables Required 13614.4.2 Normal Distributions and Equal Standard Deviations 13714.4.3 Equal Sample Sizes 13714.5 An Outline of the Test 13714.6 Planning Sample Sizes 13814.7 Carrying Out the Test 13914.8 Describing the Effect Size 13914.9 How to Report the Test 14014.9.1 Methods Section 14014.9.2 Results Section 14014.9.3 Discussion Section 14114.10 Relevant Videos etc. 14115 Repeated Measures Analysis of Variance 14315.1 When Is the Test Applied? 14315.2 An Example 14415.3 Presenting the Data 14415.3.1 Numerical Presentation of the Data 14515.3.2 Graphical Presentation of the Data 14515.4 Data Requirements 14615.4.1 Variables Required 14615.4.2 Normal Distribution of the Outcome Data 14815.4.3 Equal Standard Deviations 14815.4.4 Equal Sample Sizes 14815.5 An Outline of the Test 14815.6 Planning Sample Sizes 14915.7 Carrying Out the Test 15015.8 Describing the Effect Size 15015.9 How to Report the Test 15115.9.1 Methods Section 15115.9.2 Results Section 15115.9.3 Discussion Section 15215.10 Relevant Videos etc. 15316 Friedman Test 15516.1 When Is the Test Applied? 15516.2 An Example 15716.3 Presenting the Data 15716.3.1 Bar Charts of the Outcomes at Various Stages 15716.3.2 Summarizing the Data via Medians or Means 15716.3.3 Splitting the Data at Some Critical Point in the Scale 15916.4 Data Requirements 16016.4.1 Variables Required 16016.4.2 Normal Distribution and Standard Deviations in the Outcome Data 16016.4.3 Equal Sample Sizes 16016.5 An Outline of the Test 16016.6 Planning Sample Sizes 16116.7 Follow Up Tests 16116.8 Carrying Out the Tests 16216.9 Describing the Effect Size 16216.9.1 Median or Mean Values Among the Individual Changes 16216.9.2 Split the Scale 16216.10 How to Report the Test 16216.10.1 Methods Section 16216.10.2 Results Section 16316.10.3 Discussion Section 16416.11 Relevant Videos etc. 16417 Pearson Correlation 16517.1 Presenting the Data 16517.2 Correlation Coefficient and Statistical Significance 16617.3 Planning Sample Sizes 16717.4 Effect Size and Practical Relevance 16717.5 Regression 16917.6 How to Report the Analysis 17017.6.1 Methods 17017.6.2 Results 17017.6.3 Discussion 17117.7 Relevant Videos etc. 17118 Spearman Correlation 17318.1 Presenting the Data 17318.2 Testing for Evidence of Inappropriate Distributions 17418.3 Rho and Statistical Significance 17418.4 An Outline of the Significance Test 17518.5 Planning Sample Sizes 17518.6 Effect Size 17618.7 Where Both Measures Are Ordinal 17618.7.1 Educational Level and Willingness to Undertake Internet Research – An Example Where Both Measures Are Ordinal 17618.7.2 Presenting the Data 17718.7.3 Rho and Statistical Significance 17718.7.4 Effect Size 17818.8 How to Report Spearman Correlation Analyses 17818.8.1 Methods 17818.8.2 Results 17918.8.3 Discussion 18018.9 Relevant Videos etc. 18019 Logistic Regression 18119.1 Use of Logistic Regression with Categorical Outcomes 18119.2 An Outline of the Significance Test 18219.3 Planning Sample Sizes 18219.4 Results of the Analysis 18419.5 Describing the Effect Size 18419.6 How to Report the Analysis 18519.6.1 Methods 18519.6.2 Results 18619.6.3 Discussion 18619.7 Relevant Videos etc. 18720 Cronbach’s Alpha 18920.1 Appropriate Situations for the Use of Cronbach’s Alpha 18920.2 Inappropriate Uses of Alpha 19020.3 Interpretation 19020.4 Reverse Scoring 19120.5 An Example 19120.6 Performing and Interpreting the Analysis 19220.7 How to Report Cronbach’s Alpha Analyses 19320.7.1 Methods Section 19320.7.2 Results 19420.7.3 Discussion 19420.7 Relevant Videos etc. 195Glossary 197Videos 209Index 211