• Fri frakt över 249 kr
  • •
  • Snabba leveranser
  • •
  • Billiga böcker
Kundservice

Du är på sajten för privatpersoner.

Företag, bibliotek eller offentlig verksamhet?

Du handlar på classic.bokus.com, där alla dina funktioner finns intakta.
Till classic.bokus.com
Bokus logotyp. Gå till startsidan.
  • Erbjudanden
  • Nyheter
  • Student
  • Topplistor
  • Barn & ungdom
  • Bokus Play
  • E-böcker
  • Pocketböcker
  • Spel & pussel

10% rabatt på allt med kod NYSTART10 →

Sidfot

Mina sidor

    Hjälp

    • Kundservice
    • Vanliga frågor och svar
    • Frakt och leverans
    • Retur vid ångerrätt
    • Reklamera vara
    • Betalning
    • Köpvillkor
    • Allmänna villkor
    • Information om webbplatsens tillgänglighet

    Om Bokus

    • Om oss
    • Pressrum
    • För studenter
    • För företag
    • För bibliotek och offentlig verksamhet
    • För leverantörer
    • Hållbarhet

    Populärt

    • Aktuella erbjudanden
    • Presentkort
    • Studentlitteratur
    • Nya böcker
    • Topplistor
    • Signerade böcker
    • Engelska böcker

    Inspiration

    • Boktips
    • BookTok
    • Populära bokserier
    • Barnbokskaraktärer
    • Populära författare
    Logotyp för Bokus
    Följ oss på Facebook (extern länk)Följ oss på Instagram (extern länk)Följ oss på YouTube (extern länk)Följ oss på TikTok (extern länk)
    bokus @ CookiesAnpassa cookiesIntegritetspolicyKöpvillkor
    Till Citymail hemsida (extern länk)Till Budbee hemsida (extern länk)Till Postnord hemsida (extern länk)Till Schenker hemsida (extern länk)Till Early Bird hemsida (extern länk)Till Walleys hemsida (extern länk)
    1. Samhälle och politik
    2. Samhälle och kultur
    3. Kultur och medier
    4. Referensverk och tvärvetenskap

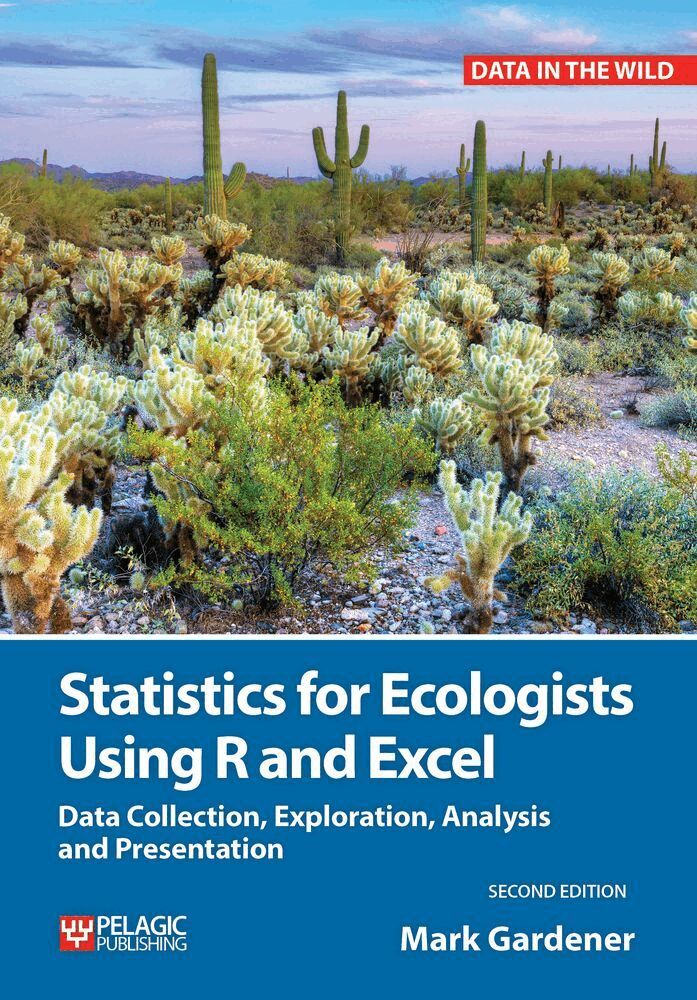
    Statistics for Ecologists Using R and Excel

    Data Collection, Exploration, Analysis and Presentation

    AvMark Gardener

    Inbunden, Engelska, 2017

    Del i serien Data in the Wild

    1 080 kr

    Beställningsvara. Skickas inom 5-8 vardagar. Fri frakt över 249 kr.

    Fler format och utgåvor

    Häftad

    636 kr

    E-bok

    2 012 kr

    E-bok

    2 012 kr

    Beskrivning

    This is a book about the scientific process and how you apply it to data in ecology. You will learn how to plan for data collection, how to assemble data, how to analyze data and finally how to present the results. The book uses Microsoft Excel and the powerful Open Source R program to carry out data handling as well as producing graphs.Statistical approaches covered include: data exploration; tests for difference – t-test and U-test; correlation – Spearman’s rank test and Pearson product-moment; association including Chi-squared tests and goodness of fit; multivariate testing using analysis of variance (ANOVA) and Kruskal–Wallis test; and multiple regression.Key skills taught in this book include: how to plan ecological projects; how to record and assemble your data; how to use R and Excel for data analysis and graphs; how to carry out a wide range of statistical analyses including analysis of variance and regression; how to create professional looking graphs; and how to present your results.New in this edition: a completely revised chapter on graphics including graph types and their uses, Excel Chart Tools, R graphics commands and producing different chart types in Excel and in R; an expanded range of support material online, including; example data, exercises and additional notes & explanations; a new chapter on basic community statistics, biodiversity and similarity; chapter summaries and end-of-chapter exercises.Praise for the first edition:This book is a superb way in for all those looking at how to design investigations and collect data to support their findings. – Sue Townsend, Biodiversity Learning Manager, Field Studies Council[M]akes it easy for the reader to synthesise R and Excel and there is extra help and sample data available on the free companion webpage if needed. I recommended this text to the university library as well as to colleagues at my student workshops on R. Although I initially bought this book when I wanted to discover R I actually also learned new techniques for data manipulation and management in Excel – Mark Edwards, EcoBloggingA must for anyone getting to grips with data analysis using R and excel. – Amazon 5-star reviewIt has been very easy to follow and will be perfect for anyone. – Amazon 5-star reviewA solid introduction to working with Excel and R. The writing is clear and informative, the book provides plenty of examples and figures so that each string of code in R or step in Excel is understood by the reader. – Goodreads, 4-star review

    Produktinformation

    • Utgivningsdatum:2017-01-09
    • Mått:170 x 244 x 31 mm
    • Vikt:1 005 g
    • Format:Inbunden
    • Språk:Engelska
    • Serie:Data in the Wild
    • Antal sidor:406
    • Upplaga:2
    • Förlag:Pelagic Publishing
    • ISBN:9781784271404

    Utforska kategorier

    • Referensverk och tvärvetenskap inom Samhälle och politik
    • Biovetenskap inom Naturvetenskap och teknik
    • Affärsapplikationer inom Data och IT

    Mer om författaren

    Mark Gardener began his career as an optician but returned to science and trained as an ecologist. His research is in the area of pollination ecology. He has worked extensively in the UK as well as Australia and the United States. Currently he works as an associate lecturer for the Open University and also runs courses in data analysis for ecology and environmental science.

    Recensioner i media

    The text that I have found most helpful in getting back to using R has been Mark Gardener's Statistics for Ecologists Using R and Excel. This excellent little book leads the reader nicely through the basics. Starting with how to down load R and getting data into the programme through exploratory statistics and into basic analysis with a section on reporting results which includes visualising data. It also makes it easy for the reader to synthesise R and Excel and there is extra help and sample data available on the free companion webpage if needed. I recommended this text to the university library as well as to colleagues at my student workshops on R. Although I initially bought this book when I wanted to discover R I actually also learned new techniques for data manipulation and management in Excel. (This review refers to the first edition.)

    Innehållsförteckning

    • Preface xi 1. Planning 2. Data recording 3. Beginning data exploration – using software tools 4. Exploring data – looking at numbers 5. Exploring data – which test is right? 6. Exploring data – using graphs 7. Tests for differences 8. Tests for linking data – correlations 9. Tests for linking data – associations 10. Differences between more than two samples 11. Tests for linking several factors 12. Community ecology 13. Reporting results 14. Summary Glossary Appendices Index