• Fri frakt över 249 kr
  • •
  • Snabba leveranser
  • •
  • Billiga böcker
Kundservice

Du är på sajten för privatpersoner.

Företag, bibliotek eller offentlig verksamhet?

Du handlar på classic.bokus.com, där alla dina funktioner finns intakta.
Till classic.bokus.com
Bokus logotyp. Gå till startsidan.
  • Erbjudanden
  • Nyheter
  • Student
  • Topplistor
  • Barn & ungdom
  • Bokus Play
  • E-böcker
  • Pocketböcker
  • Spel & pussel

10% rabatt på allt med kod NYSTART10 →

Sidfot

Mina sidor

    Hjälp

    • Kundservice
    • Vanliga frågor och svar
    • Frakt och leverans
    • Retur vid ångerrätt
    • Reklamera vara
    • Betalning
    • Köpvillkor
    • Allmänna villkor
    • Information om webbplatsens tillgänglighet

    Om Bokus

    • Om oss
    • Pressrum
    • För studenter
    • För företag
    • För bibliotek och offentlig verksamhet
    • För leverantörer
    • Hållbarhet

    Populärt

    • Aktuella erbjudanden
    • Presentkort
    • Studentlitteratur
    • Nya böcker
    • Topplistor
    • Signerade böcker
    • Engelska böcker

    Inspiration

    • Boktips
    • BookTok
    • Populära bokserier
    • Barnbokskaraktärer
    • Populära författare
    Logotyp för Bokus
    Följ oss på Facebook (extern länk)Följ oss på Instagram (extern länk)Följ oss på YouTube (extern länk)Följ oss på TikTok (extern länk)
    bokus @ CookiesAnpassa cookiesIntegritetspolicyKöpvillkor
    Till Citymail hemsida (extern länk)Till Budbee hemsida (extern länk)Till Postnord hemsida (extern länk)Till Schenker hemsida (extern länk)Till Early Bird hemsida (extern länk)Till Walleys hemsida (extern länk)
    1. Samhälle och politik
    2. Samhälle och kultur
    3. Kultur och medier
    4. Referensverk och tvärvetenskap

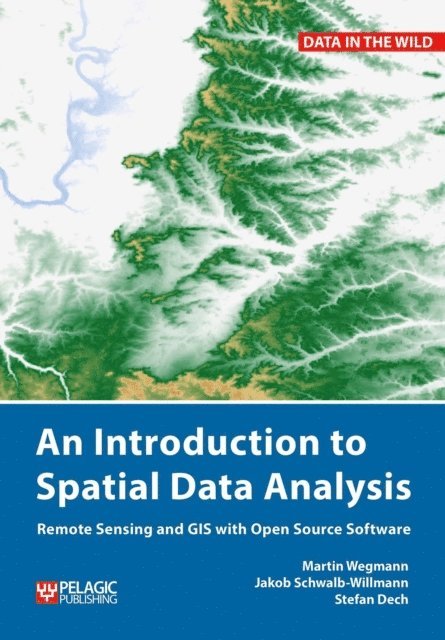
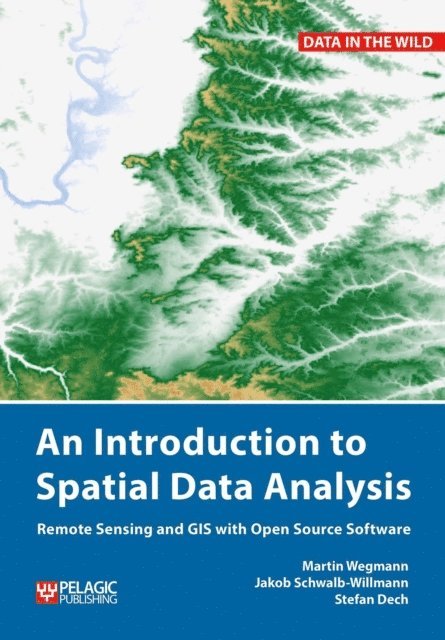
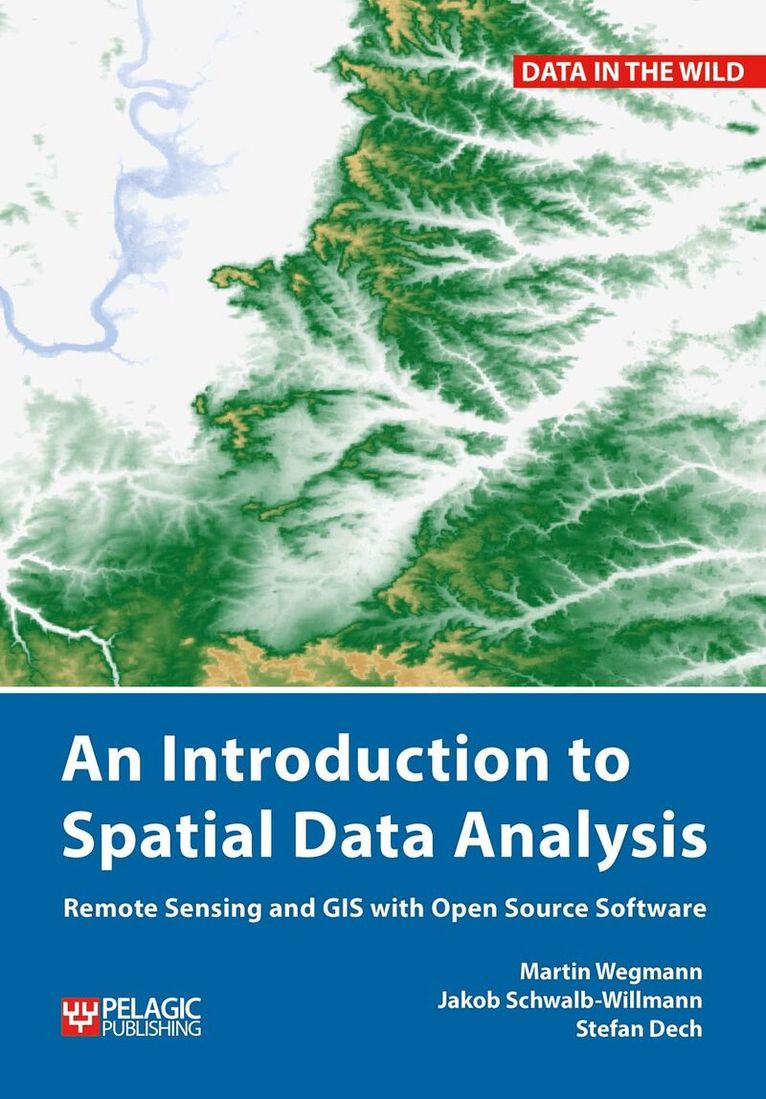
    Introduction to Spatial Data Analysis

    Remote Sensing and GIS with Open Source Software

    AvMartin Wegmann,Jakob Schwalb-Willmann

    Inbunden, Engelska, 2020

    Del i serien Data in the Wild

    1 419 kr

    Beställningsvara. Skickas inom 5-8 vardagar. Fri frakt över 249 kr.

    Fler format och utgåvor

    Häftad

    594 kr

    Beskrivning

    This is a book about how ecologists can integrate remote sensing and GIS in their research. It will allow readers to get started with the application of remote sensing and to understand its potential and limitations. Using practical examples, the book covers all necessary steps from planning field campaigns to deriving ecologically relevant information through remote sensing and modelling of species distributions.An Introduction to Spatial Data Analysis introduces spatial data handling using the open source software Quantum GIS (QGIS). In addition, readers will be guided through their first steps in the R programming language. The authors explain the fundamentals of spatial data handling and analysis, empowering the reader to turn data acquired in the field into actual spatial data. Readers will learn to process and analyse spatial data of different types and interpret the data and results. After finishing this book, readers will be able to address questions such as “What is the distance to the border of the protected area?”, “Which points are located close to a road?”, “Which fraction of land cover types exist in my study area?” using different software and techniques.This book is for novice spatial data users and does not assume any prior knowledge of spatial data itself or practical experience working with such data sets. Readers will likely include student and professional ecologists, geographers and any environmental scientists or practitioners who need to collect, visualize and analyse spatial data.The software used is the widely applied open source scientific programs QGIS and R. All scripts and data sets used in the book will be provided online at book.ecosens.org.This book covers specific methods including:what to consider before collecting in situ datahow to work with spatial data collected in situthe difference between raster and vector datahow to acquire further vector and raster datahow to create relevant environmental informationhow to combine and analyse in situ and remote sensing datahow to create useful maps for field work and presentationshow to use QGIS and R for spatial analysishow to develop analysis scripts

    Produktinformation

    • Utgivningsdatum:2020-09-07
    • Mått:170 x 244 x 17 mm
    • Vikt:600 g
    • Format:Inbunden
    • Språk:Engelska
    • Serie:Data in the Wild
    • Antal sidor:222
    • Förlag:Pelagic Publishing
    • ISBN:9781784272128

    Utforska kategorier

    • Referensverk och tvärvetenskap inom Samhälle och politik
    • Databaser inom Data och IT
    • Biovetenskap inom Naturvetenskap och teknik

    Mer om författaren

    Martin Wegmann works on remote sensing for biodiversity and conservation applications at the Department of Remote Sensing, University of Würzburg. He also teaches remote sensing within the applied Earth Observation EAGLE M.Sc. program and the AniMove.org science school. He has more than 15 years of experience in working with spatial data for ecological applications using Open Source software.Jakob Schwalb-Willmann is a scientist at the University of Würzburg with an academic background in Earth observation and spatial data science. His research focuses on the machine-learning-driven analysis and exploitation of integrated movement tracking and remote sensing data for geoanalytical applications. He has extensive experience in using and developing Open Source software tools for advanced image and spatial data anaylsis.Stefan Dech is director of the German Remote Sensing Data Center (DFD) since 1998, and current spokesman of the Earth Observation Center (EOC) at the German Aerospace Center (DLR). Since 2001 he has held the Chair for Remote Sensing at the Institute of Geography and Geology of the University of Würzburg.

    Innehållsförteckning

    • Preface1. Introduction and overview 1.1 Spatial data1.2 First spatial data analysis1.3 Next steps Part I.Data acquisition, data preparation and map creation2. Data acquisition2.1 Spatial data for a research question 2.2 AOI2.3 Thematic raster map acquisition2.4 Thematic vector map acquisition 2.5 Satellite sensor data acquisition 2.6 Summary and further reading3. Data preparation 3.1 Deciding on a projection 3.2 Reprojecting raster and vector layers3.3 Clipping to an AOI3.4 Stacking raster layers3.5 Visualizing a raster stack as RGB3.6 Summary and further reading4. Creating maps4.1 Maps in QGIS4.2 Maps for presentations 4.3 Maps with statistical information4.4 Common mistakes and recommendations4.5 Summary and further readingPart II.Spatial field data acquisition and auxiliary data5. Field data planning and preparation5.1 Field sampling strategies5.2 From GIS to global positioning system (GPS)5.3 On-screen digitization 5.4 Summary and further reading6.Field sampling using a global positioning system (GPS) 976.1GPS in the field 986.2GPX from GPS 1016.3Summary 1027.From global positioning system (GPS) to geographic information system (GIS) 1037.1Joint coordinates and measurement sheet 1047.2Separate coordinates and measurement sheet 1057.3Point measurement to information 1067.4Summary 108Part III.Data analysis and new spatial information8.Vector data analysis 1108.1Percentage area covered 1148.2Spatial distances 1188.3Summary and further analyses 1219.Raster analysis 1229.1Spectral landscape indices 1229.2Topographic indices 1289.3Spectral landscape categories 1289.4Summary and further analysis 13310.Raster-vector intersection 13410.1Point statistics 13510.2Zonal statistics 13610.3Summary 138Part IV.Spatial coding11.Introduction to coding 14011.1Why use the command line and what is ‘R’? 14011.2Getting started 14211.3Your very first command 14211.4Classes of data 14411.5Data indexing (subsetting) 14511.6Importing and exporting data 14711.7Functions 14811.8Loops 14911.9Scripts 14911.10Expanding functionality 15011.11Bugs, problems and challenges 15111.12Notation 15211.13Summary and further reading 15212.Getting started with spatial coding 15312.1Spatial data in R 15312.2Importing and exporting data 15812.3Modifying spatial data 16212.4Downloading spatial data from within R 16612.5Organization of spatial analysis scripts 17012.6Summary 17113.Spatial analysis in R 17213.1Vegetation indices 17213.2Digital elevation model (DEM) derivatives 17413.3Classification 17513.4Raster-vector interaction 17913.5Calculating and saving aggregated values 18213.6Summary and further reading 18414.Creating graphs in R 18514.1Aggregated environmental information 18514.2Non-aggregated environmental information 18914.3Finalizing and saving the plot 19414.4Summary and further reading 19515.Creating maps in R 19615.1Vector data 19715.2Plotting study area data 20215.3Summary and further reading 206Afterword and acknowledgements 207References 209Index 210