• Fri frakt över 249 kr
  • •
  • Snabba leveranser
  • •
  • Billiga böcker
Kundservice

Du är på sajten för privatpersoner.

Företag, bibliotek eller offentlig verksamhet?

Du handlar på classic.bokus.com, där alla dina funktioner finns intakta.
Till classic.bokus.com
Bokus logotyp. Gå till startsidan.
  • Erbjudanden
  • Nyheter
  • Student
  • Topplistor
  • Barn & ungdom
  • Bokus Play
  • E-böcker
  • Pocketböcker
  • Spel & pussel

10% rabatt på allt med kod: NYSTART10 →

Sidfot

Mina sidor

    Hjälp

    • Kundservice
    • Vanliga frågor och svar
    • Frakt och leverans
    • Retur vid ångerrätt
    • Reklamera vara
    • Betalning
    • Köpvillkor
    • Allmänna villkor
    • Information om webbplatsens tillgänglighet

    Om Bokus

    • Om oss
    • Pressrum
    • För studenter
    • För företag
    • För bibliotek och offentlig verksamhet
    • För leverantörer
    • Hållbarhet

    Populärt

    • Aktuella erbjudanden
    • Presentkort
    • Studentlitteratur
    • Nya böcker
    • Topplistor
    • Signerade böcker
    • Engelska böcker

    Inspiration

    • Boktips
    • BookTok
    • Populära bokserier
    • Barnbokskaraktärer
    • Populära författare
    Logotyp för Bokus
    Följ oss på Facebook (extern länk)Följ oss på Instagram (extern länk)Följ oss på YouTube (extern länk)Följ oss på TikTok (extern länk)
    bokus @ CookiesAnpassa cookiesIntegritetspolicyKöpvillkor
    Till Citymail hemsida (extern länk)Till Budbee hemsida (extern länk)Till Postnord hemsida (extern länk)Till Schenker hemsida (extern länk)Till Early Bird hemsida (extern länk)Till Walleys hemsida (extern länk)
    1. Samhälle och politik
    2. Samhälle och kultur
    3. Kultur och medier
    4. Kulturvetenskap

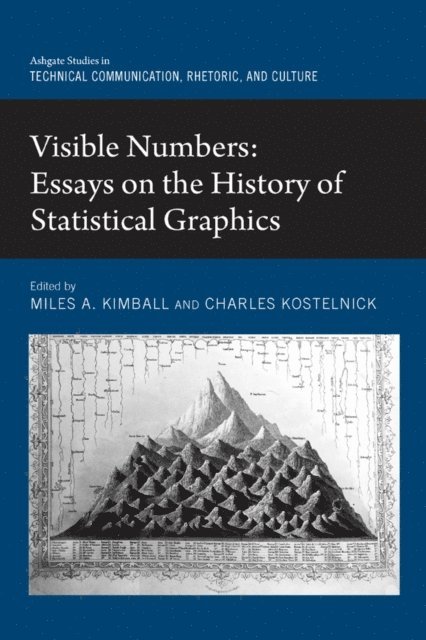
    Visible Numbers

    Essays on the History of Statistical Graphics

    AvCharles Kostelnick,Miles A. Kimball

    E-bok
    PDF, Engelska, 2017

    925 kr

    Läs direkt i Bokus Reader – eller ladda ned till din enhet (PDF kräver ofta zoom och scroll på små skärmar).

    Beskrivning

    Bringing together scholars from around the world, this collection examines many of the historical developments in making data visible through charts, graphs, thematic maps, and now interactive displays. Today, we are used to seeing data portrayed in a dizzying array of graphic forms. Virtually any quantified knowledge, from social and physical science to engineering and medicine, as well as business, government, or personal activity, has been visualized. Yet the methods of making data visible are relatively new innovations, most stemming from eighteenth- and nineteenth-century innovations that arose as a logical response to a growing desire to quantify everything-from science, economics, and industry to population, health, and crime. Innovators such as Playfair, Alexander von Humboldt, Heinrich Berghaus, John Snow, Florence Nightingale, Francis Galton, and Charles Minard began to develop graphical methods to make data and their relations more visible. In the twentieth century, data design became both increasingly specialized within new and existing disciplines-science, engineering, social science, and medicine-and at the same time became further democratized, with new forms that make statistical, business, and government data more accessible to the public. At the close of the twentieth century and the beginning of the twenty-first, an explosion in interactive digital data design has exponentially increased our access to data. The contributors analyze this fascinating history through a variety of critical approaches, including visual rhetoric, visual culture, genre theory, and fully contextualized historical scholarship.

    Produktinformation

    • Utgivningsdatum:2017-07-05
    • Språk:Engelska
    • Filformat:PDF
    • Kopieringsskydd:LCP
    • ISBN:9781351537612
    • Förlag:Taylor & Francis

    Utforska kategorier

    • Kulturvetenskap inom Samhälle och politik
    • Matematisk statistik inom Naturvetenskap och teknik
    • Naturvetenskapens historia inom Naturvetenskap och teknik